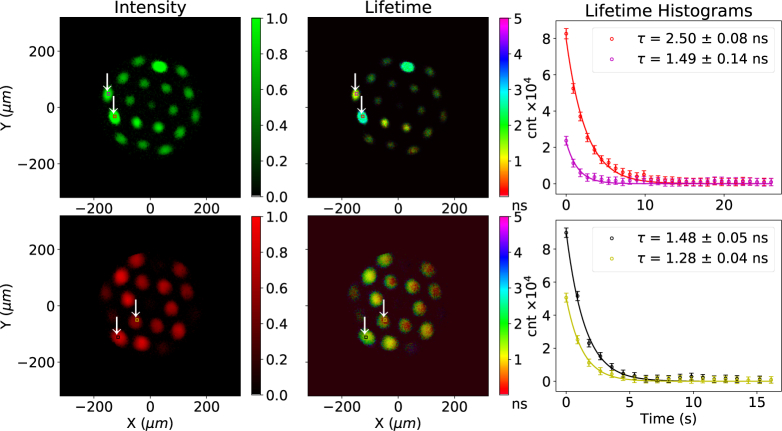
Fig. 3.
A multi-core fiber loaded with four different fluorescent microspheres acquired at 1 FPS. Top shows the green channel and bottom the red channel. The left hand column shows a fluorescence image, the center column a lifetime image. The plots show the lifetime measured from two distinct areas of elements in the figures, marked by red and purple squares on the top row and black and yellow squares on the bottom row. The plots and the uncertainties were obtained using a single exponential fit with the scipy.optimize.leastsq module [25]. The FLIM images use the center-of-mass method [18]. The effect of varying intensity observed in the left panels is noticed as varying transparency in the middle (lifetime) panels.

