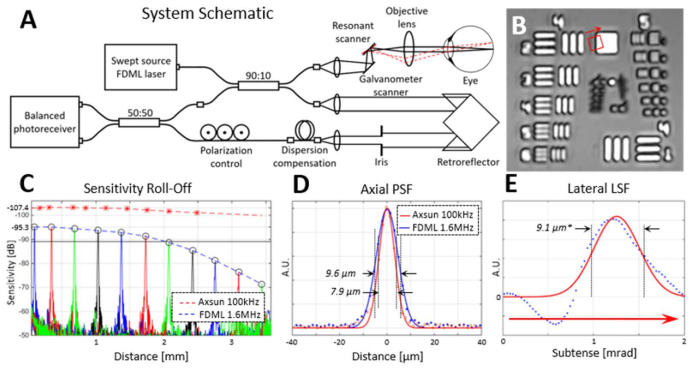
Fig. 1.
Specifications of the imaging system. (A) Optical system layout using two fiber couplers to enable balanced detection. A small, custom fiber patch cord is added to the reference portion of the interferometer to compensate for most of the dispersion mismatch. (B) Image of a 1951 USAF resolution test chart imaged through a 50 mm lens in the place of the subject’s eye. Elements from group 4 and the first from group 5 are clearly visible. (C) Sensitivity roll-off graph of the systems is shown as determined with a calibrated mirror. Sensitivity is reduced to 6 dB below the peak value at approximately 2 mm of distance in the fast FDML system. For the slower system, the −6 dB point is beyond the ~3.5 mm range of the acquisition. (D) The axial resolution of the two systems. (E) Lateral line-spread function, measured as an angular subtense, is a proxy for the lateral point-spread function. It was determined from a fit (red curve) of the derivative (blue dots) of the feature edge highlighted by the red square and arrow in (B). The resolution (9.1µm) denoted in E indicates an indirect estimation of the angular resolution multiplied by the effective focal length of a standard human eye (16.7mm).

