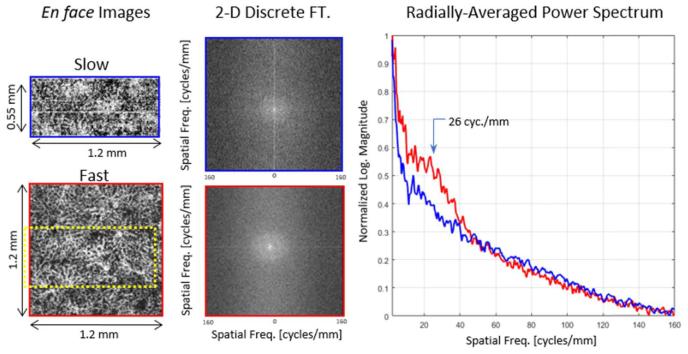
Fig. 4.
Example of radially-averaged power spectra for two images taken at the foveal center on subject 4. The left column shows the two original en face projections of the choriocapillaris using the slow (top) and fast (bottom) systems. The dashed yellow rectangle in the bottom-left image indicates where the top-left image is located relatively. The 2D discrete Fourier transform of both images is shown in the middle column. From each point in the 2D spectral image, the radial distance is computed and summed into the appropriate frequency bin of the point in the plot to the right. The maxima and minima of each curve are set to the boundaries of one and zero, respectively.

