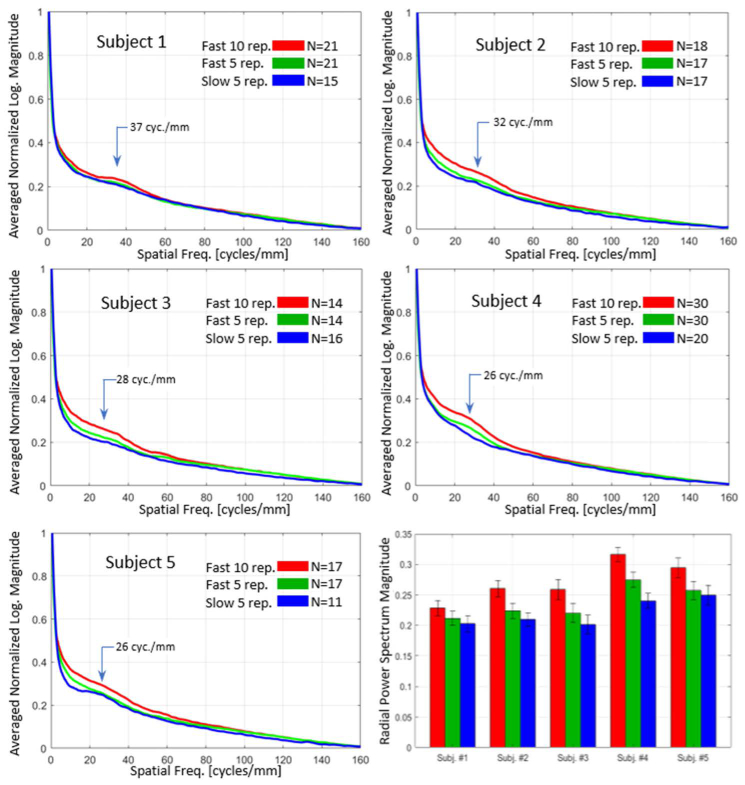
Fig. 5.
Radially-averaged power spectrum (RAPS) curves of the choriocapillaris images from all five subjects (top left, top right, middle row, and bottom left). All curves are the averages from many individual images taken throughout the macula, as designated by the number (N) in the legend of each panel of the figure. A summary bar chart of the relative heights of the power spectrum at a chosen spatial frequency is shown in the bottom right. The chosen frequency roughly matches the density of choriocapillaris vessels and the knee shape in the curve. Error bars denote one standard deviation.

