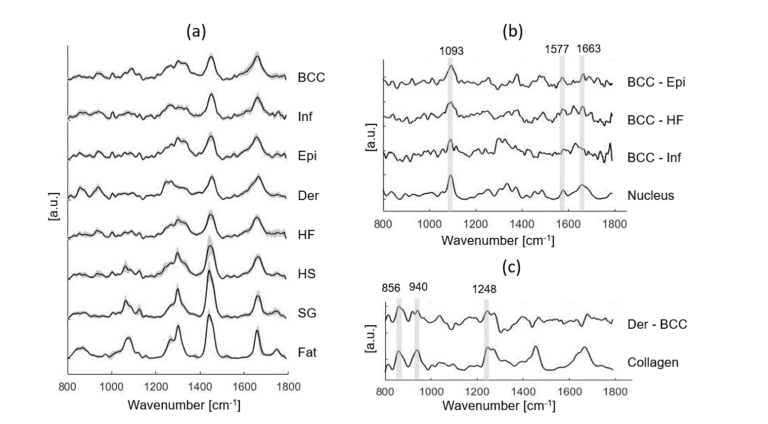
Fig. 3.
(a) Mean Raman spectra ± SD of all individual tissue structures, including BCC, Inf (inflamed dermis), Epi (epidermis), Der (dermis), HF (hair follicle), HS (hair shaft), SG (sebaceous gland) and fat. (b) Spectral differences of mean spectra of BCC minus Epi, BCC minus HF, and BCC minus Inf are compared with the basis spectrum of nucleus. (c) Spectral difference of mean spectra of dermis minus BCC is compared with the basis spectrum of collagen. Peak positions of the main Raman bands are labeled.

