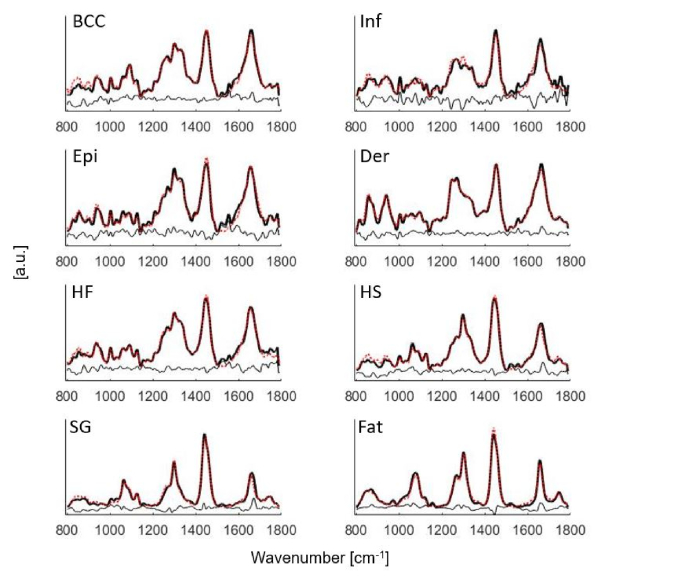
Fig. 4.
Mean Raman spectra of BCC, Inf (inflamed dermis), Epi (epidermis), Der (dermis), HF (hair follicle), HS (hair shaft), SG (sebaceous gland) and fat fit to the model components in Fig. 1. Black solid lines: mean tissue spectra. Red dotted lines: model fits. Residuals are also plotted on the bottom.

