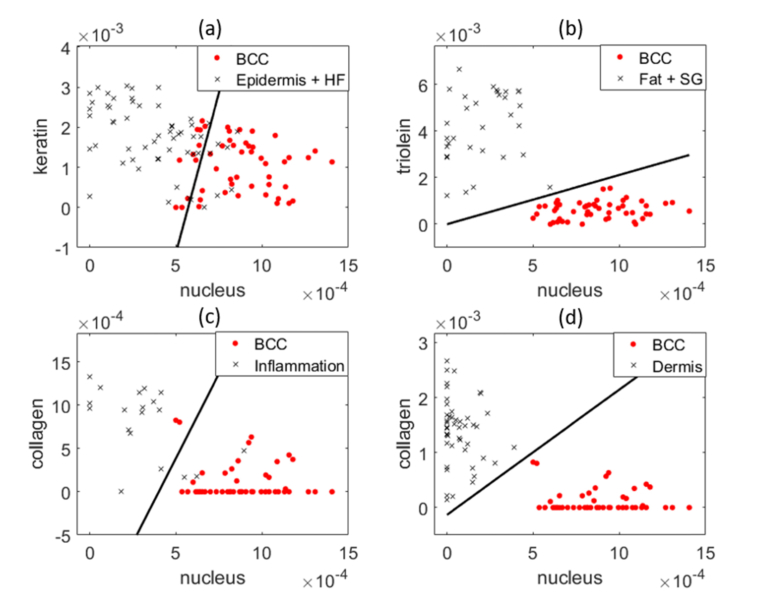
Fig. 7.
Scatter plots demonstrates the performance of two primary model components in discriminating BCC from normal structures. (a) Nucleus and keratin content of BCC, epidermis and HF. (b) Nucleus and triolein content of BCC, fat and SG. (c) Nucleus and ceramide content of BCC and inflamed dermis. (d) Nucleus and collagen content of BCC and dermis. Red dots: BCC. Black crosses: normal tissue structures. Each point represents a spectrum data. The black line is the decision line drawn by logistic regression.

