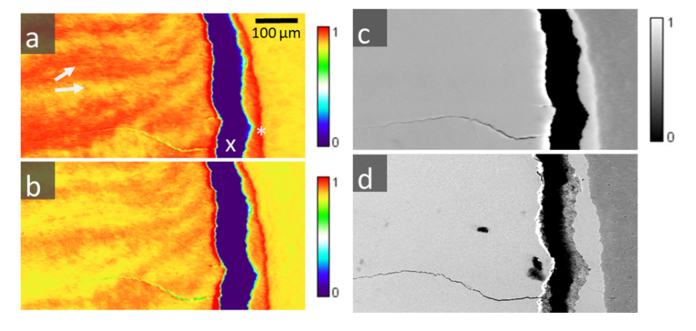
Fig. 4.
Three μXRF maps (a), (b) and (c) collected over the same region (enamel, dentine) at three different energies: a) E1 = 4.0553 keV, b) E2 = 4.0533 keV, and c) E3 = 4.2 keV, respectively. Figure d) is a backscattered SEM image of the same region, where contrast is proportional to the atomic density. The images show enamel (on the left side), a large vertical crack (indicated with an x) due to sample preparation and a small section of dentine (on the right). Enamel and dentine are typically attached at the DEJ (marked as X). At E1 and E2 (a, b) XRF-PIC reveals alternating crystalline texture of the c-HAP crystals with variations observed between adjacent prism groups (e.g. a, white arrows), similar to optically-formed Hunter Schreger bands. These effects are not visible at the higher excitation energy E3, further away from the 1s to 4p electron transition (c), where only electron density differences between enamel and dentine are observable. These are due to different Ca densities, as evidenced also by d) - backscattered electrons (SEM) of the same area as a)-c).

