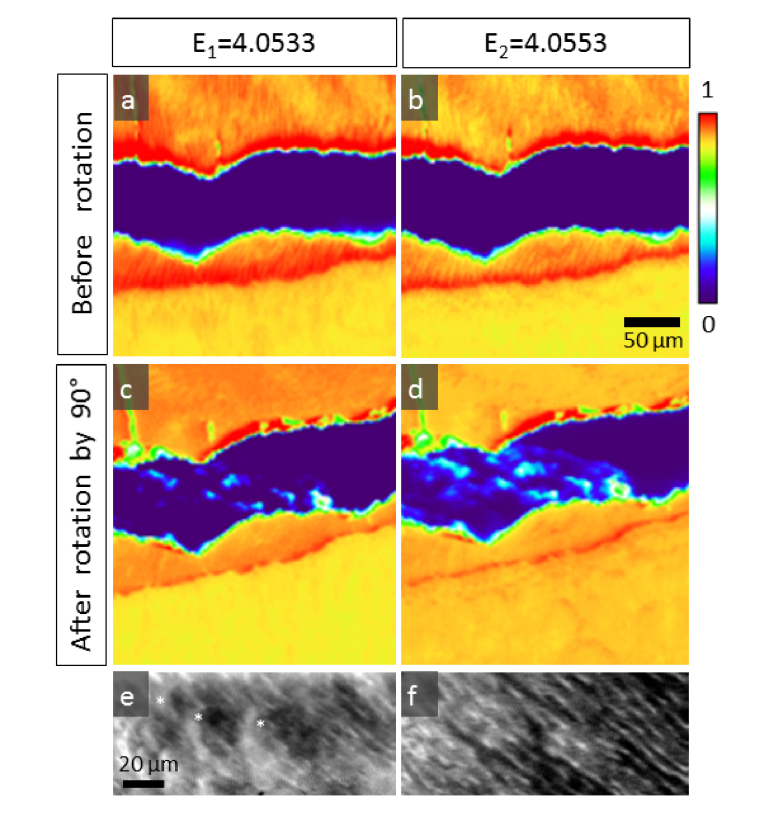
Fig. 5.
High resolution High resolution polarization sensitive μXRF maps of enamel and dentine. Maps collected at (a) E1 = 4.0533 keV and (b) E2 = 4.0553 keV reveal polarization contrast of the micro/nano crystal arrangements. Prism texture in enamel is clearly visible in the maps. Following rotation of the sample by 90° with respect to the polarization vector, the contrast between different crystal families in enamel vanishes, compare (c) at E1 = 4.0533 keV and (d) at E2 = 4.0553 keV. In dentine, spherulite curves (marked as *) are seen at E1 = 4.0533 keV (e) and peritubular dentine traces (white lines) become visible at E2 = 4.0553 keV (f).

