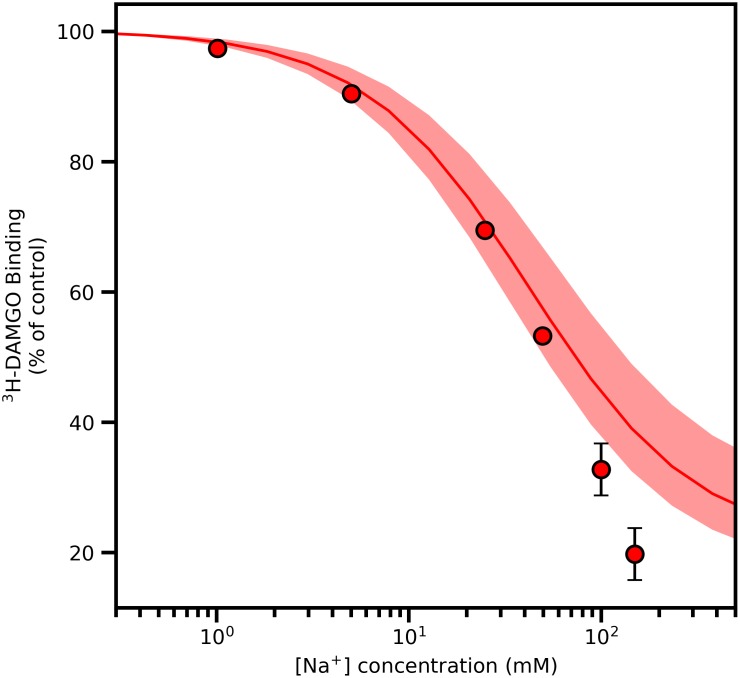
Fig 5. Percent change in [3H]-DAMGO binding as a function of increasing concentrations of NaCl, reported for a concentration of [3H]-DAMGO of 1 nM, and assuming a [3H]-DAMGO binding constant of 4 nM.
Circles represent values from radioligand binding experiments, the solid line represents the predictions from the simulation data while the shaded region corresponds to the errors associated with the predictions. Binding values are the means ± s.e.m. of three independent experiments. Error bars that are not visible are smaller than the size of the symbol.

