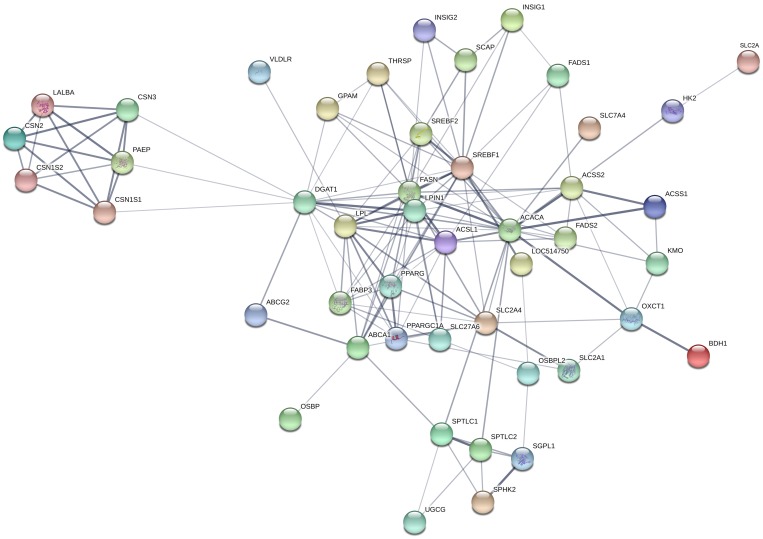
Fig 4. Protein-protein interactions among top 20 differentially expressed candidate genes and differentially expressed genes for milk traits from lactation stage comparisons in Jersey cattle.
In the network view, nodes are proteins while edges represent predicted functional interactions; the low interaction nodes are hidden.

