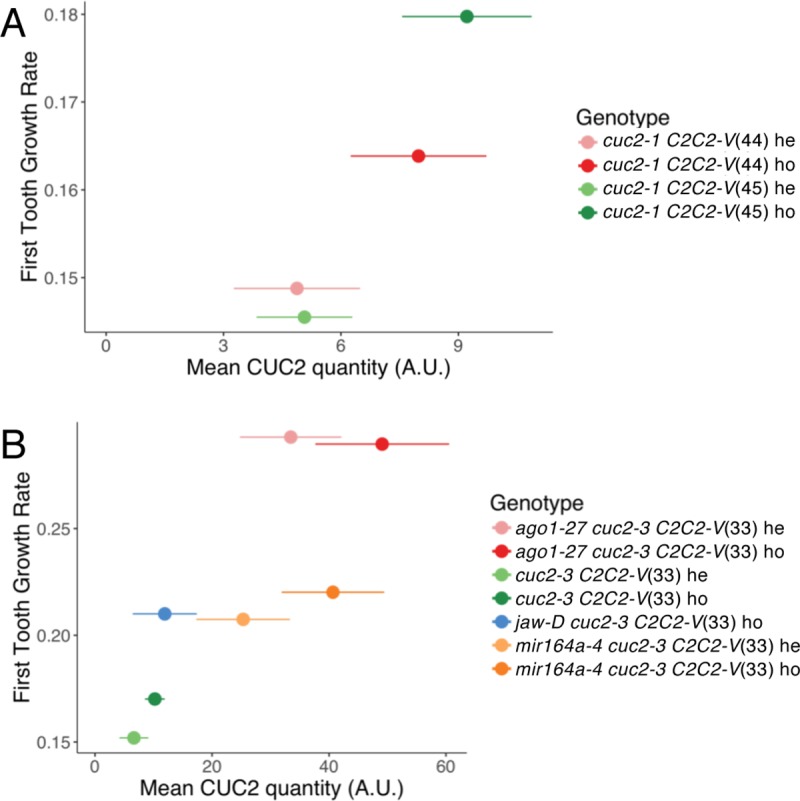
Fig 3. CUC2 levels determine tooth growth rate.

Correlation between tooth growth rate and CUC2 levels. CUC2 levels and first tooth growth rate were measured in cuc2-1 (A) or cuc2-3 backgrounds (B). These lines were either homozygous (ho) or heterozygous (he) for a pCUC2:CUC2:VENUS construct (noted C2C2-V), inserted in one of three possible loci (named 33, 44 and 45) and could be combined with different genetic backgrounds (mir164a-4 or ago1-27). CUC2 quantity is calculated for blade length between 400 and 600μm, (sinus number n ≥ 8), and is represented as mean ± SD (see S2 Fig for details). The Spearman’s rank correlation coefficients rs are 0.80 and 0.85 for (A) and (B) respectively and the associated p-values are 0.02 and 0.33 for (A) and (B).
