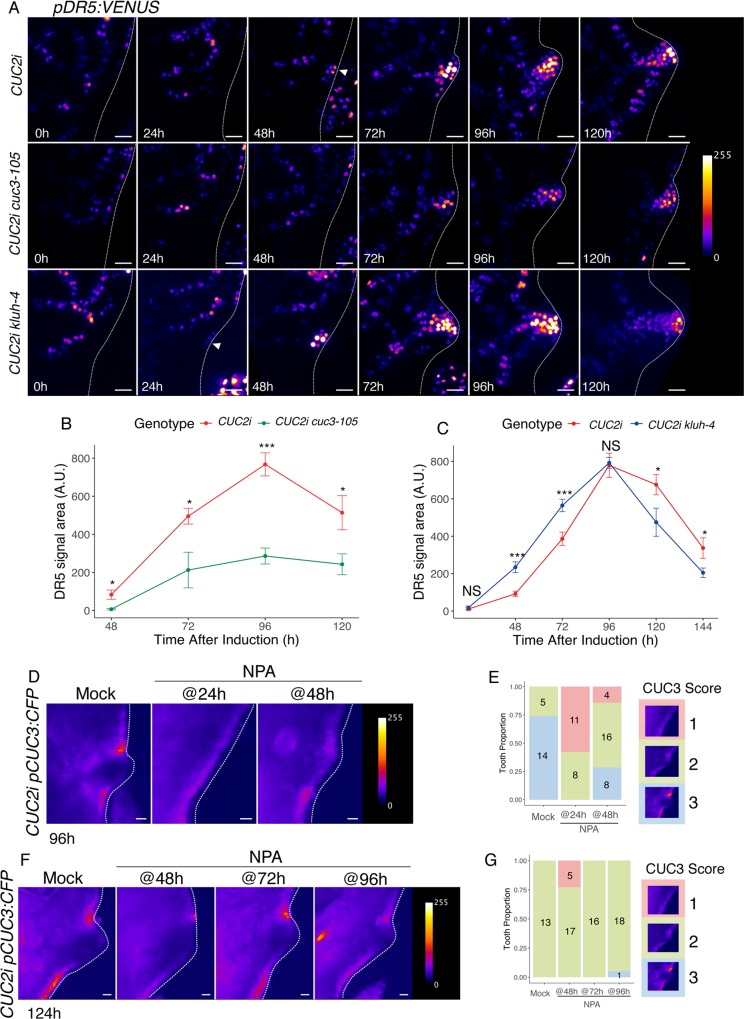
Fig 9. Interactions between CUC2 relays during tooth formation.
(A) Dynamics of pDR5:VENUS after an 8h ethanol induction in either CUC2i, CUC2i cuc3-105 or CUC2i kluh-4 backgrounds. Time following induction start is indicated. The white arrowhead points to the newly formed pDR5:VENUS maximum at the leaf margin at 48h in the CUC2i background, while at the same time no such maximum is visible in the CUC2i cuc3-105 background. Note that the pDR5:VENUS maximum domain remains smaller and less strong in the CUC2i cuc3-105 background compared to the control CUC2i line. Note that the 0h time-point corresponds to an un-induced control. (B-C) DR5-VENUS signal area quantification in the CUC2i cuc3-105 (B) or CUC2i kluh-4 (C) backgrounds compared to CUC2i, along time after induction. DR5-VENUS signal area was quantified on images after applying a threshold that allows to separate signal from background. Data are mean ± SEM, tooth number n ≥ 4. Statistical significance (Student’s test) is designated by * p<0.05, *** p<0.005. (D) pCUC3:CFP expression observed 96h after an 8h ethanol induction in a CUC2i background and following either NPA application 24h (NPA @24h) or 48h (NPA @48h) after ethanol induction start. Pixel intensity is represented with the Fire LUT (E) Scoring of discontinuity in pCUC3:CFP expression in a CUC2i background after an 8h ethanol induction and following NPA applications. The classes used to score pCUC3:CFP expression were defined based on the dynamics observed for its expression following induction of RFP-CUC2 expression (see Fig 4B): class 1 continuous expression profile; class 2 discontinuous profile, class 3 discontinuous profile and strong signal in the margin epidermis. Sample number is indicated in bars. (F) pCUC3:CFP expression observed 124h after an 8h ethanol induction in a CUC2i background and following either NPA application 48h (NPA @48h), 72h (NPA @72h) or 96h (NPA @96h) after ethanol induction start. Pixel intensity is represented with the Fire LUT. (G) Scoring of discontinuity in pCUC3:CFP expression in a CUC2i background after an 8h ethanol induction and following late NPA applications. Scoring was done as in (E) except that the observations were made 124h after the start of the ethanol induction instead of 96h. Scale bars: (A) 20μm; (D, F) 50μm.

