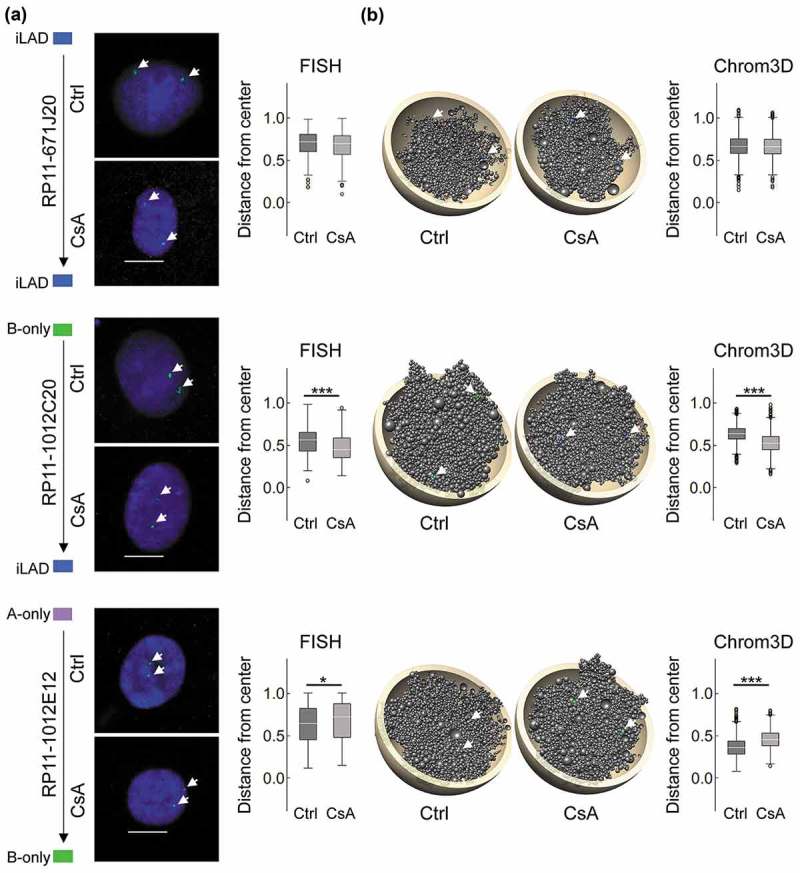
Figure 4.

Chrom3D and FISH analysis of radial repositioning of loci after CsA treatment. (a) FISH analysis of locus positioning (arrows) in indicated LADs in control and CsA-treated cells. Representative FISH images are shown, with normalized probe distance from the nuclear center (0 = center; 1 = periphery defined as the border of DAPI staining; n = 100 nuclei analyzed per probe per condition; bars, 10 µm), (b) Chrom3D models showing FISH probe positions (arrows), and normalized probe distance from the nuclear center measured in 800 models. Probe number is shown. P-values: FISH: *P = 0.006, ***P = 1.4 × 10⁻⁵; unpaired t-tests; Chrom3D: ***P < 2.2 × 10⁻¹⁶, unpaired t-tests. See also Supplementary Figure S2.
