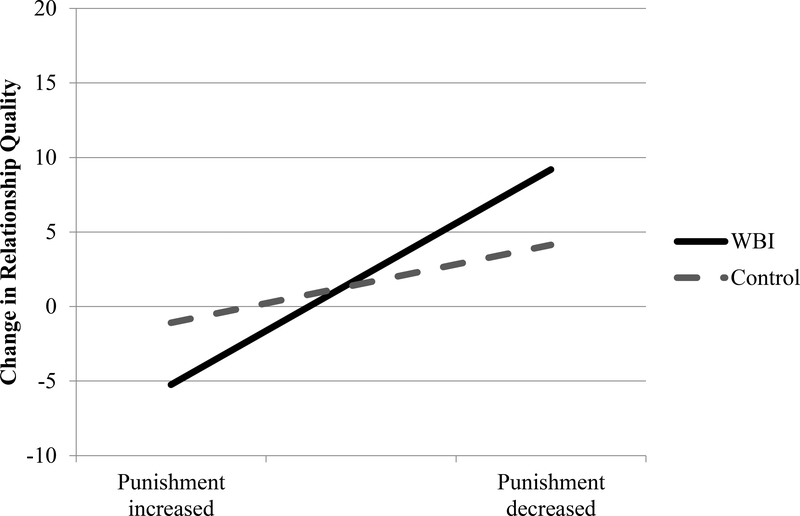
Figure 4. Relationship between changes in punishment of partner drinking from time 1 to time 2 and changes in CP perceptions of relationship quality.
Note: Following Aiken and West (1991) and Cohen, Cohen, West, and Aiken (2003), lines are graphed at 1 SD above and below the mean change in punishment from baseline. Simple slopes tests for difference from 0 were: WBI b = 1.93, SE = 0.33, t(108) = 5.91, p < .001; Control b = 0.77, SE = 0.44, t(64) = 1.74, p = .09.

