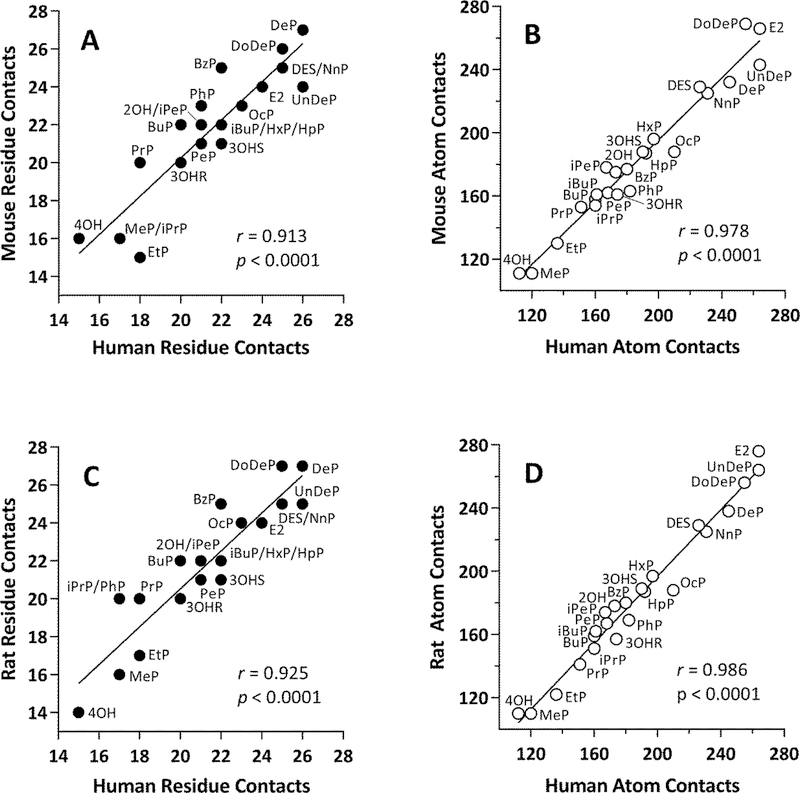
Fig. 6.
Correlations of numbers of contacts for Group A ligands docked into human and rodent ERα-LBD receptors. (A) Human-mouse residue contacts. (B) Human-mouse atom contacts. (C) Human-rat residue contacts. (D) Human-rat atom contacts. Residue contacts = filled circles, atom contacts = open circles. Each data point is labeled with the ligand name (See Fig. 2 and Table 1). The Pearson correlation coefficient (r) and associated p-value are shown in each panel.

