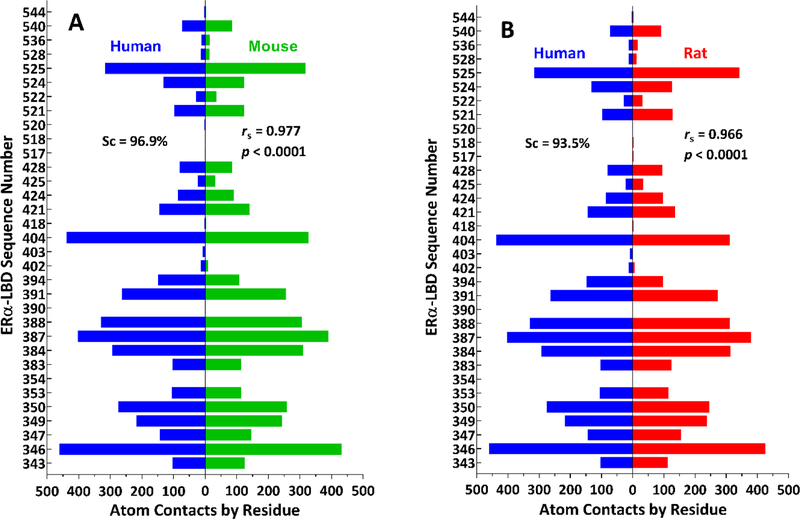
Fig. 7.
Numbers of ligand-receptor atom contacts by residue for all Group A ligands docked into human and rodent ERα-LBD receptors. (A) Human (blue bars on left) and mouse (green bars on right) receptors. Human (blue bars on left) and rat (red bars on right) receptors. The Sorensen similarity coefficient (Sc, expressed as a percentage) along with the Spearman correlation coefficient (rs) and associated p-value are shown in each panel. Vertical axis = ERα-LBD sequence number; horizontal axis = number of atom contacts by residue.

