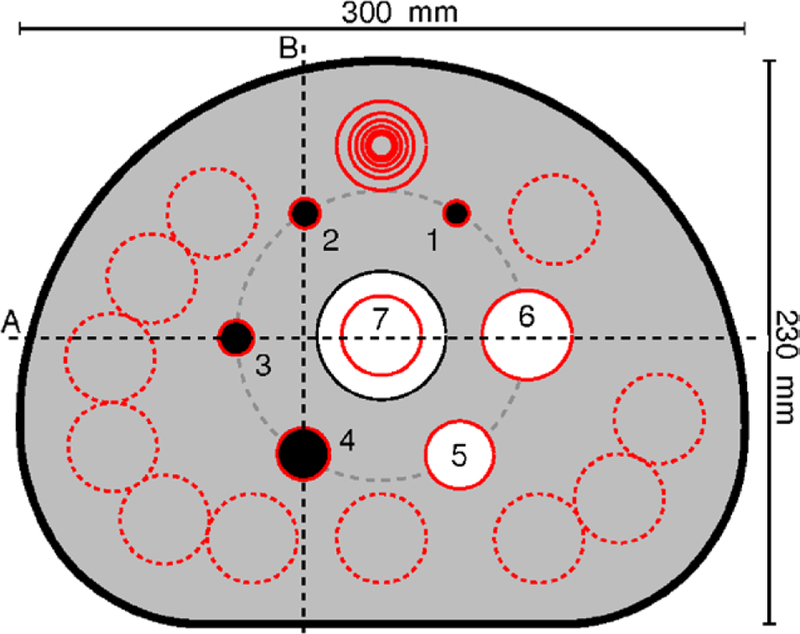
Figure 4.

Transaxial cross section through the center of the spheres inside the IEC NEMA Body Phantom (schematic drawing). The four smallest spheres (1–4) represented hot lesions, the two largest spheres (5 and 6) cold lesions. For image quality assessment, a circular ROI was drawn on each sphere, the ROI diameter being as close as possible to the internal diameter of the sphere. A 30 mm circular ROI was drawn on the lung insert (7). Twelve ROIs of each size were drawn on the warm phantom background. Two profile lines (A and B) were drawn on the phantom.
