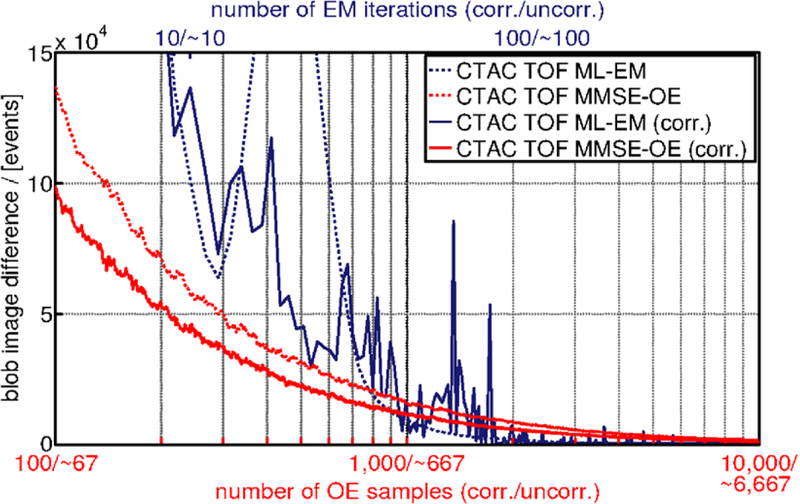
Figure 7.

Difference of the blob image to its predecessor, measured each time after drawing a sample from the OE Markov chain, and after each iteration of the ML-EM algorithm, respectively. ML-EM iterations are scaled to MMSE-OE samples with respect to computing time.
