. 2019 Feb 5;8:e40032. doi: 10.7554/eLife.40032

Figure 1. L. monocytogenes spreads anisotropically through a polarized, confluent MDCK cell monolayer.

(A) On the left three panels, micrographs show nuclei (Hoechst, blue) and intracellular bacteria (mTagRFP, red) at three different time points post-infection. Green boundaries fully enclose all bacteria. On the fourth panel, boundaries (shades of green) depict the progression of the infection focus boundaries at nine evenly-spaced time points (see colorbar). (B) Examples of four different foci boundaries through time. (C) Quantification of total bacterial fluorescence intensity as a function of time for five different foci. Semi-log plot in inset. (D) Quantification of mean squared displacement (MSD) as a function of time for five different foci. Log-log plot in inset where short solid line indicates linear scaling. For C and D, each focus is represented by a different color.

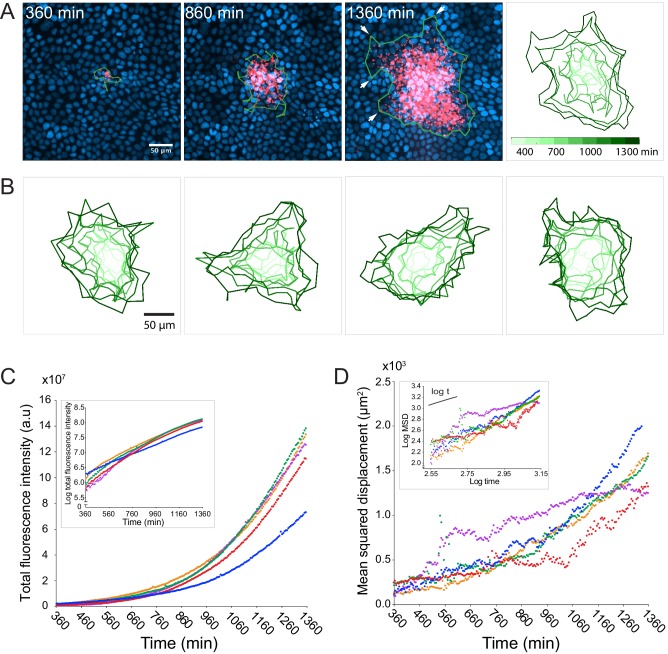
Figure 1—source data 1. This spreadsheet contains the total fluorescence intensity (a.u.), mean squared displacement (µm2), doubling time (min), and diffusion coefficient (µm2/min) data used to generate the graphs in Figure 1C and D, and in Figure 1—figure supplement 1A, B and C.
DOI: 10.7554/eLife.40032.005

Figure 1.

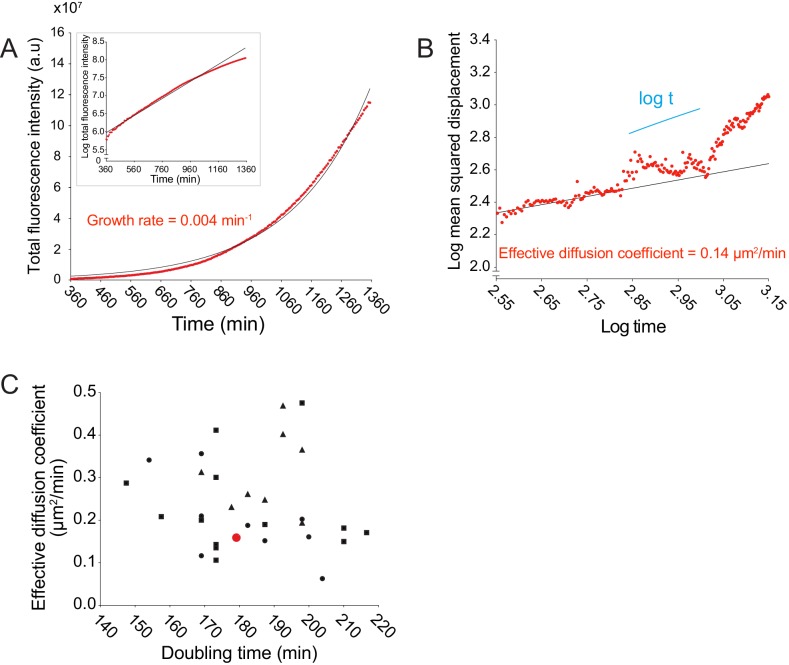
Figure 1—figure supplement 1. Doubling times (min) and effective diffusion coefficients (µm2/min) for live microscopy data are uncorrelated.

Figure 1—figure supplement 1.

(A) Data quantifying the total bacterial fluorescence intensity as a function of time. Data points were fit to an exponential function (solid black line). Growth rate was estimated from the exponential fit. Semi-log plot in inset: log-transformed data in red and linear fit in black. (B) Data quantifying the log of MSD as a function of the log of time. Log-transformed data points, from start to ~2.95 log time, were fit to a linear function (solid black line). Effective diffusion coefficient was calculated by dividing the slope of the linear fit by 4. Short solid line indicates linear scaling. (C) Data plotting effective diffusion coefficients versus doubling times, which were calculated by dividing the natural log of 2 by the growth rate. Each data point represents an independent time-lapse movie. Each shape represents an independent experiment. Red data point corresponds to the data shown in panels A and B.