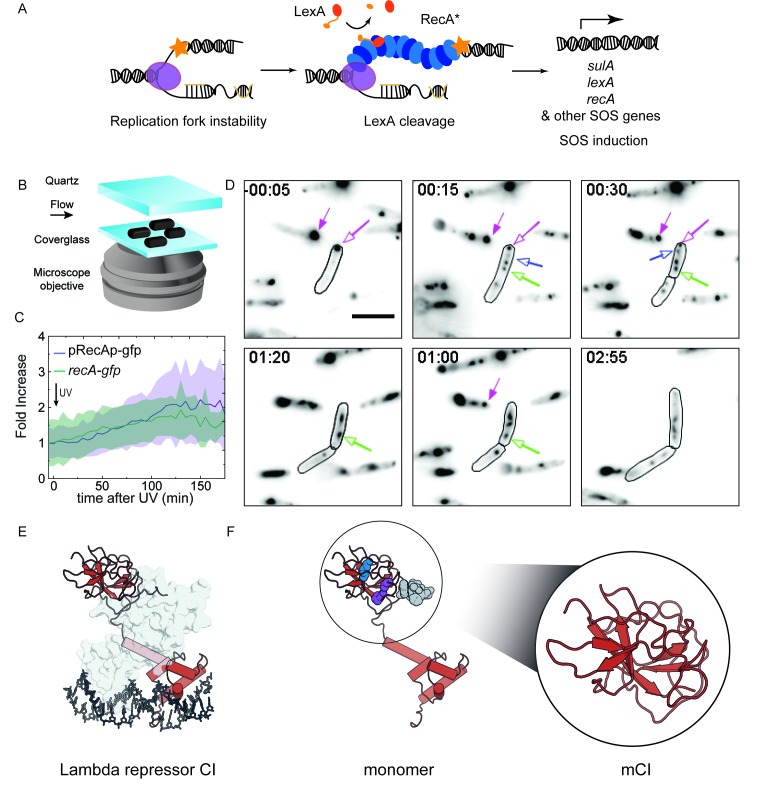
Figure 1. RecA forms different intracellular structures in response to UV irradiation.
(A) Consensus model for SOS induction after DNA damage, illustrating the formation of ssDNA-containing RecA* filaments at sites of stalled replication forks. These RecA* filaments induce the SOS response by promoting cleavage of LexA. (B) Schematic of flow-cell setup for live-cell imaging. (C) Plots of relative increase in mean intensity of GFP in pRecAp-gfp cells (purple, strain# HG260) or RecA-GFP expressed from the native chromosomal locus (recA-gfp cells). Cells are irradiated with 20 Jm−2 of UV at t = 0 min. Shaded error bars represent standard deviation of the mean cellular fluorescence measured in cells across the population. Between 50–200 cells were analyzed from 30 fields of view at each time point and two independent experiments were performed for each condition. See also Figure 1—video 1. (D) Imaging of recA-gfp cells (strain# HG195) reveals that RecA-GFP forms foci of various morphologies at different stages during the SOS response upon exposure to 20 Jm−2 of UV. Magenta arrows indicate foci that are present before damage and disappear during the SOS response. Blue arrows indicate foci that appear after damage. Green arrow represents a focus that converts into a bundle. Cell outlines are provided as a guide to the eye. At least two independent experiments were performed with 30 fields of view at each time point. Stills from Figure 1—video 2 are presented here. Scale bar corresponds to 5 μm. (E) Crystal structure of the operator bound dimeric λ repressor CI (PDB ID: 3BDN). (F) Monomer of CI showing the catalytic lysine (K192, purple), residues that mediate dimerization (A152 and P158, blue), and the C terminus involved in dimerization (grey). Inset shows the monomeric C-terminal fragment ‘mCI’ defined as CI(101–229, A152T P158A and K192A) used in this study.

