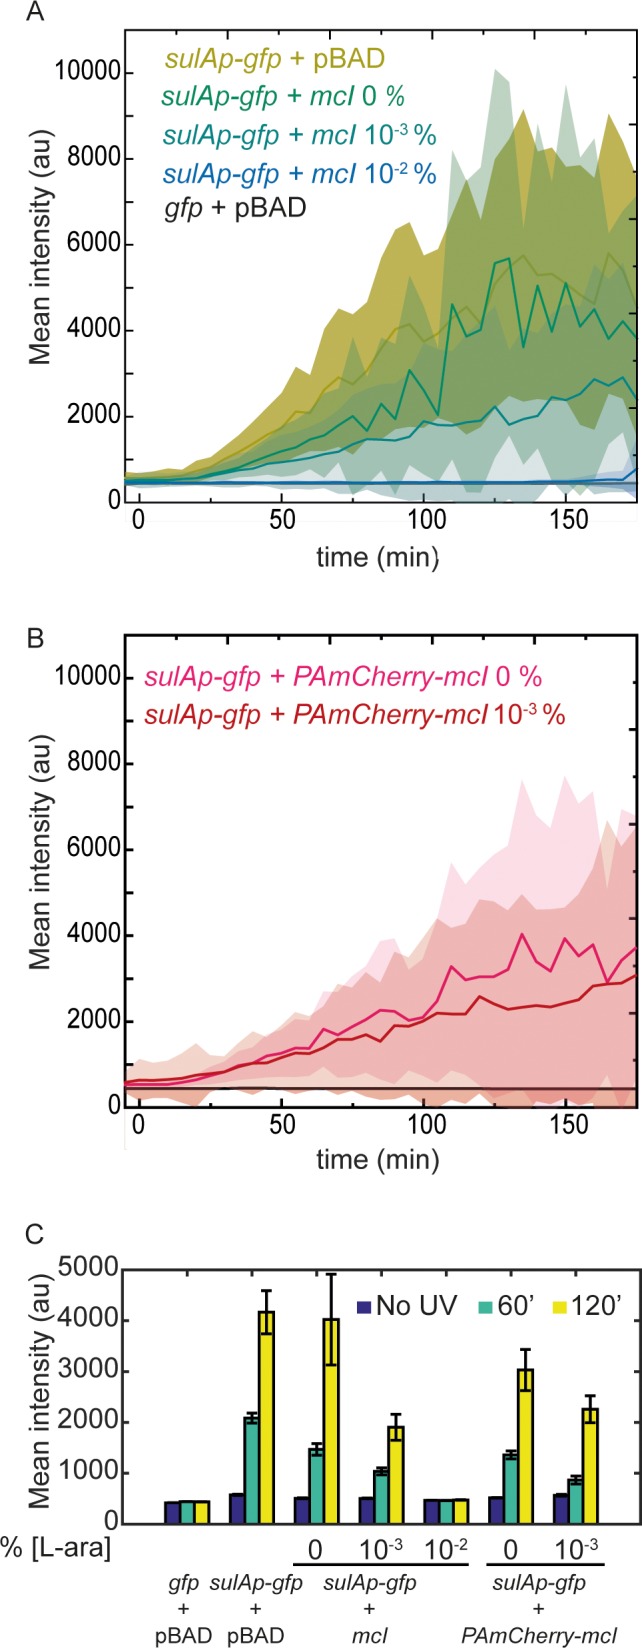
Figure 3. mCI inhibits the SOS response in a concentration-dependent manner.
(A) Time-lapse experiments were performed on MG1655 cells carrying the SOS-reporter plasmids (‘gfp’ or ‘sulAp-gfp’) and pBAD-mCI plasmid (‘mcI’) following irradiation with 20 Jm−2 of UV-irradiation at time t = 0 min. Mean intensity of GFP fluorescence was measured in cells carrying the reporter plasmid and mCI or empty vector, and plotted here as follows: ‘sulAp-gfp +pBAD’ cells (yellow; strain# HG258), ‘gfp +pBAD’ cells (black; strain# HG257), ‘sulAp-gfp +mcI’ (strain# HG253) (0% L-ara) (green), 10−3% L-ara (blue) and 10−2% L-ara (purple), respectively. (B) Mean intensity of GFP fluorescence in cells carrying the reporter plasmid and pBAD-PAmCherry-mcI plasmid (‘sulAp-gfp +PAmCherry-mcI’) (strain# HG285; 0% L-ara (pink) and 10-3% L-ara (red)) is plotted as a function of time. Shaded error bars indicate standard deviation of cellular fluorescence for all cells imaged at the indicated time point. Standard deviation was plotted to emphasize the variation of the cellular fluorescence across the population. In these experiments, 10–200 cells were analyzed from 12 fields of view at each of the 37 time points, from one independent repeat for each experimental condition. (C) Bar plots summarizing data presented in B and C under the indicated conditions at a time point before UV irradiation, one at 60, and one at 120 min after UV. Here, error bars represent standard error of the mean cellular fluorescence for all cells imaged at the indicated time point.

