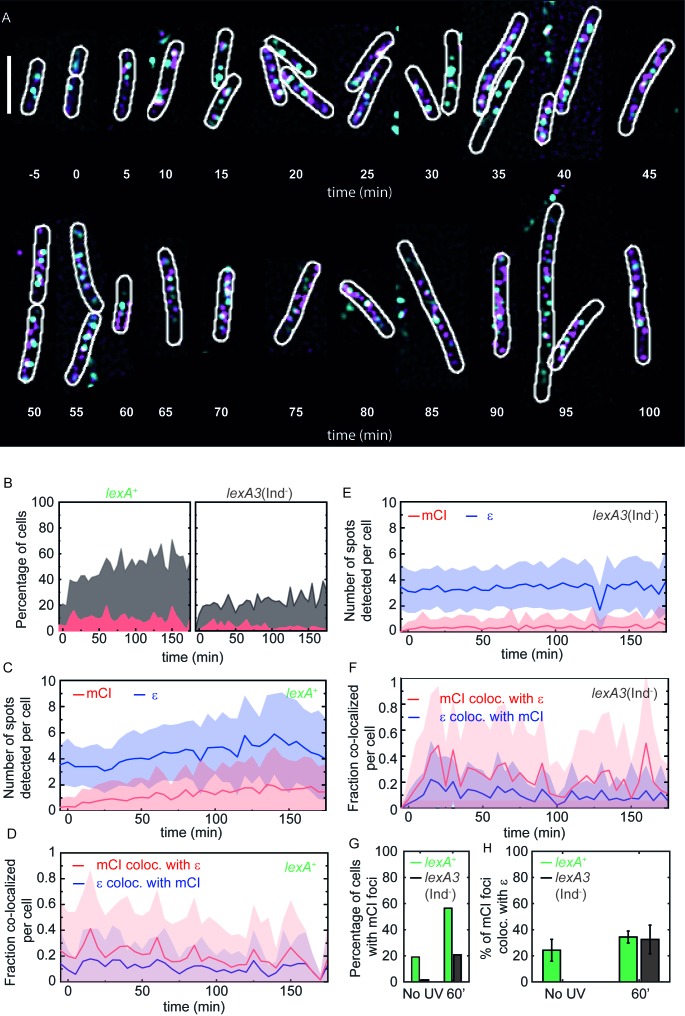
Figure 4. mCI co-localization with the replisome after UV irradiation.
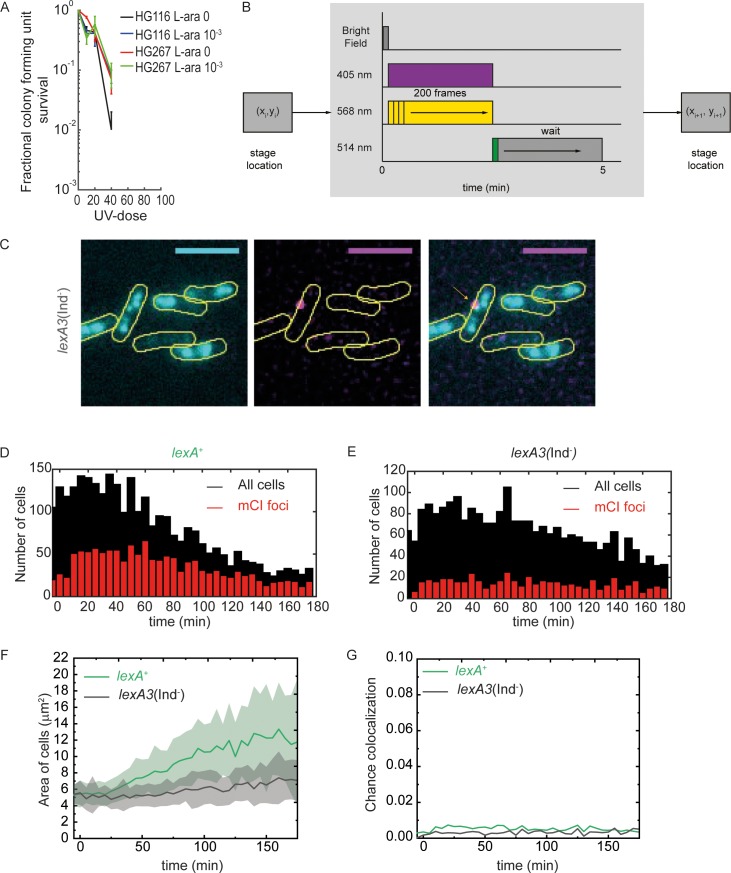
(A) MG1655 cells carrying the ϵ-YPet replisome marker (cyan) and expressing PAmCherry-mCI (magenta) from the pBAD-PAmCherry-mcI plasmid (strain# HG267) were grown in the presence of 5 × 10⁻⁴% L-arabinose and irradiated with 20 Jm−2 of UV-irradiation followed by imaging for three hours. Examples of lexA+ (strain# HG267) provided at indicated time points (B) The percentage of cells (light gray) imaged at each time point is shown for lexA+ (N = 4 independent repeats) and lexA3(Ind-) (N = 3 independent repeats) cells. Of these, the percentage of cells exhibiting replisome as well as, mCI foci is indicated in dark gray. Red area indicates the number of cells in the population where mCI is co-localized with replisomes. Total cell counts for each time point are presented in Figure 4—figure supplement 1D. Number of replisome foci and PAmCherry foci were counted for each time point per cell for (C) lexA+ and (D) lexA3(Ind-) cells from the pooled data set. In cells exhibiting at least one replisome focus and one PAmCherry-mCI focus, the fraction of replisomes co-localizing with PAmCherry-mCI was determined (blue) and the fraction of PAmCherry-mCI co-localizing with replisomes was determined (red) for (E) lexA+ and (F) lexA3(Ind-) cells. (G) Bar plots summarizing percentage of cells exhibiting at least one mCI focus for lexA+ (green) and lexA3(Ind-) (gray) cells before UV and at 60 min after UV irradiation. (H) Bar plots summarizing extent of co-localization of ϵ-YPet and PAmCherry-mCI in cells with at least one mCI and ϵ focus. Data are presented as mean ± SEM calculated at each time point. 25–150 cells were analyzed for each time point. See also Figure 4—figure supplement 1.


