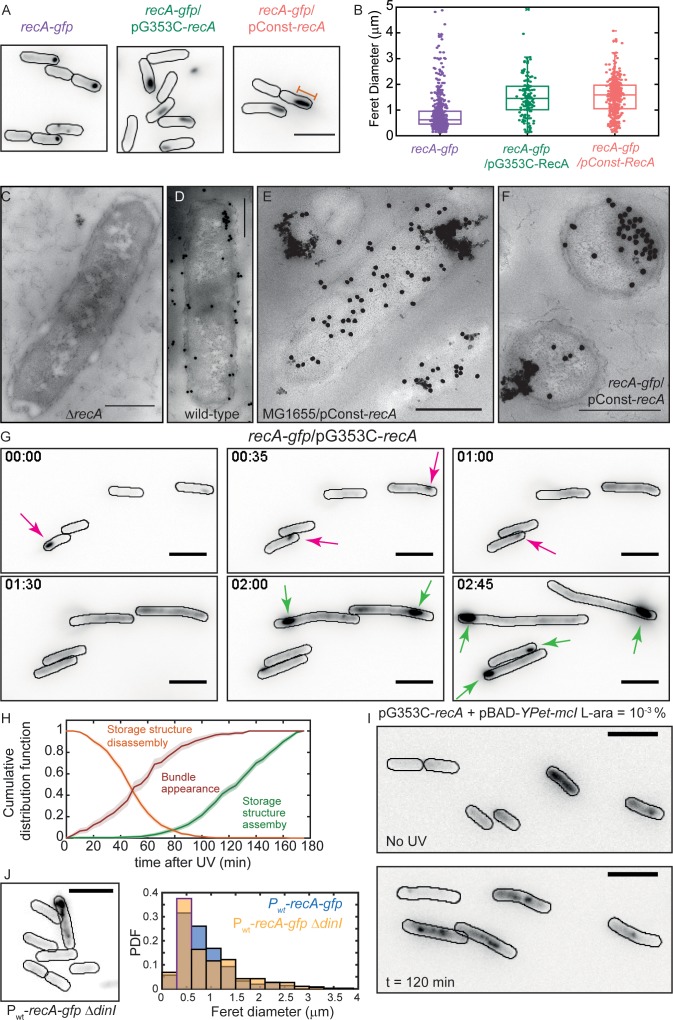
Figure 6. Excess RecA is stored in storage-structures.
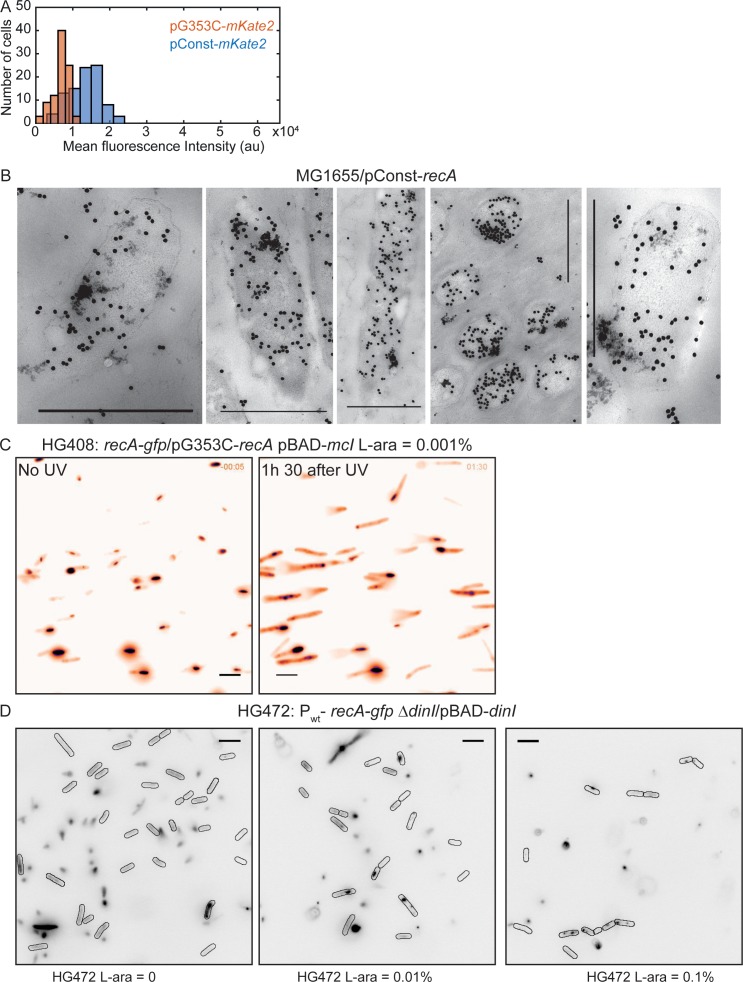
(A) Montage of recA-gfp (strain# HG195), recA-gfp/pG353C-recA (strain# HG406) and recA-gfp/pConst-recA cells (strain# HG411) imaged in the absence of UV damage. See also Figure 6—video 1. Scale bar corresponds to 5 μm. (B) Box and whiskers plot of maximum Feret diameter of storage structures in recA-gfp (purple; n = 528 structures), recA-gfp/pG353C-recA (green; n = 137 structures) and recA-gfp/pConst-recA cells (orange; n = 399 structures). Mean and 25th/75th percentile are encapsulated in the box. Orange bar in panel A represents the maximum Feret diameter for that particular storage structure. Pairwise Kolmogorov-Smirnov test to compare the distributions of the Feret diameters of the storage structures revealed statistically significant differences for recA-gfp vs. recA-gfp/pG353C-recA (p = 1.3327×10⁻²⁹) and recA-gfp vs. recA-gfp/pConst-recA (p = 1.54×10−60), rejecting the null hypothesis that the measurements for the two strains arise from the same distribution. Electron microscopy images of (C) ΔrecA (D) wild-type recA (E) MG1655/pConst-recA and (F) recA-gfp/pConst-recA cells stained with gold nanoparticles labelled with RecA antibody. Note the appearance of aggregates of gold nanoparticles in panel E at locations consistent with those observed in panel A for recA-gfp/pConst-recA cells. Untagged, over-expressed RecA reveals gold nanoparticle localizations consistent with those expected from RecA storage structures. Scale bar corresponds to 1 μm. (G) Montage of frames from a time-lapse experiment of recA-gfp/pG353C-recA cells exposed to UV (see also Figure 6—video 2). RecA forms storage structures in the absence of DNA damage (0 min) in cells. Storage structures dynamically dissolve after DNA damage (1 hr; magenta arrows). Storage structures reform by sequestering excess RecA synthesized during SOS after repair (2 hr and 2 hr 45 min time points; green arrows). N = 5 independent experiments. (H) Cumulative probability distributions of time of solubilization of storage structure (yellow) and time of appearance (light green) of storage structures from recA-gfp/pG353C-recA (strain# HG406) cells (N = 4 independent experiments). Red line represents cumulative distribution function of time of first incidence of RecA bundles in recA-gfp cells (strain# HG195, n = 108 bundles). Shaded error bars represent standard deviation of the bootstrap distribution obtained by sampling 80% of the data 1000 times. In each case, 100–150 cells were analyzed that were present for the duration of observation (3 hr). (I) YPet-mCI does not stain storage structures in MG1655/pG353C-recA pBAD-YPet-mcI cells (strain# HG446) in the absence of DNA damage, but forms features after UV damage (shown here is a still at 120 min). Cell outlines provided as a guide to the eye. N = 2 independent experiments. See also Figure 6—video 3, and Figure 6—figure supplement 1. Scale bar represents 5 μm. (J) MG1655 cells carrying the recA-gfp fusion under the native recA promoter and ΔdinI (strain# EAW767) exhibit fewer storage structures than dinI+ cells. On average, 27% of EAW767 (Pwt-recA-gfp ΔdinI) cells exhibited structures (mean Feret diameter = 0.9 ± 0.6 μm, n = 702 cells), compared to 43% of EAW428 (Pwt-recA-gfp) cells (mean Feret diameter = 0.9 ± 0.5 μm, n = 855 cells). N = 2 independent experiments. Scale bar represents 5 μm. See also Figure 6—figure supplement 1. A Kolmogorov-Smirnov test to compare the two distributions did not reject the null hypothesis that the two measurements of the Feret diameters for the two strains arose from the same distribution, resulting in a p-value of 0.15.


