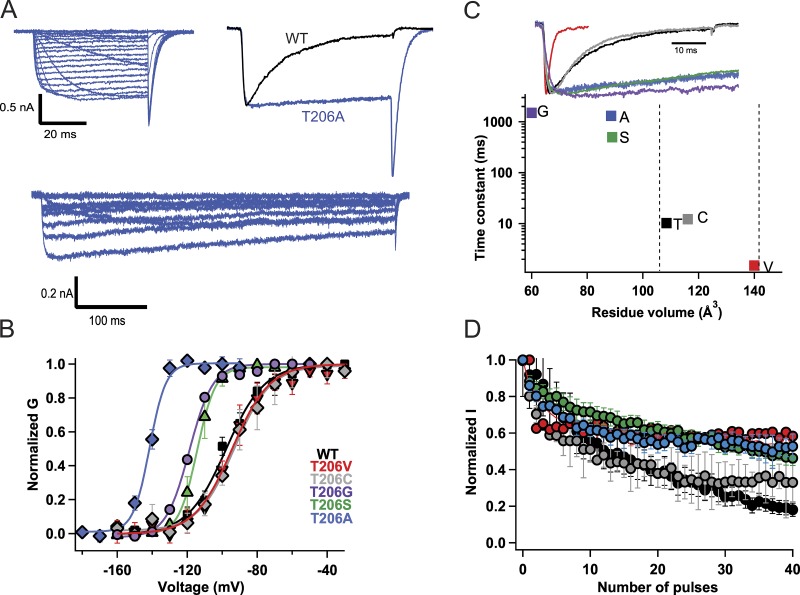
Figure 1.
Size-dependent effects of mutations of Thr206 on the early phase of inactivation. (A) Top left: Representative current traces of NaVAb/T206A. Cells were held at −180 mV, and 50-ms depolarizing pulses were applied in 10-mV steps from −180 mV to +50 mV. Top right: Comparison of NavAb/T206A inactivation during the pulse (blue) to NaVAb/WT (black). The 100-ms pulse was applied from a holding potential of −180 mV to −70 mV. Bottom: Representative current traces of NaVAb/T206A recorded during 500-ms depolarizing pulses from −180 mV to +50 mV. (B) Voltage dependence of NaVAb/WT and mutants: NaVAb/WT, V1/2 = −97 ± 1.4 mV (black circles; n = 7); NaVAb/T206A, V1/2 = −121 ± 2 mV (blue; n = 5); NaVAb/T206S, V1/2 = −115 ± 1 mV, (green); NaVAb/T206C, V1/2 = −95 ± 4 mV (gray; n = 7); NaVAb/T206V, V1/2 = −95 ± 0.9 mV (red; n = 8). The activation curves were constructed from I–V curves in which 500-ms depolarizing pulses were applied. (C) Top: Representative current traces showing inactivation kinetics of NaVAb Thr206 mutants compared with NaVAb WT. Bottom: Time constants for early voltage-dependent inactivation plotted versus the volume of the amino acid residue at position 206. (D) Peak inward currents measured during each pulse of 1-Hz trains of depolarizations and normalized to the current produced by the first depolarization of the train for NaVAb/WT (black), T206C (gray), T206S (green), T206V (red), T206G (purple), and T206A (blue). Error bars represent SEM.

