Figure 3.
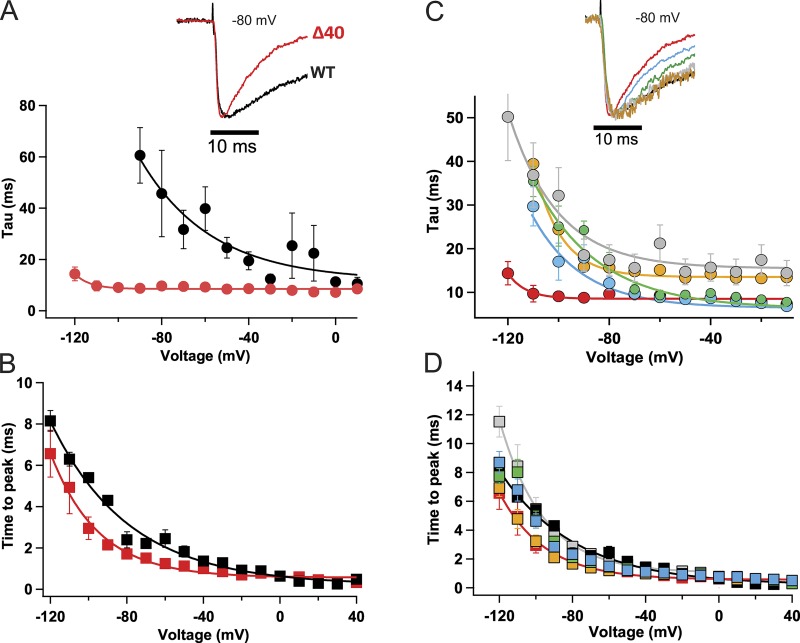
Truncation of the C-terminal tail accelerates the early phase of inactivation. (A) Cells were held at −180 mV, and 50-ms depolarizing pulses were applied in 10-mV steps from −180 mV to +50 mV. Top: Comparison of NaVAbΔ40 inactivation during the pulse (red) to NaVAb/WT (black) during a depolarizing pulse from a holding potential of −180 mV to −80 mV. Bottom: Time constant of the decay of current during depolarizations to the indicated potentials for NaVAbΔ40 (red, n = 4) and NaVAb/WT (black, n = 7). The NaVAb/WT inactivation time constants were adapted from previous work (Gamal El-Din et al., 2013) for ease of comparison. (B) Time to peak current for NaVAbΔ40 (red) and NaVAb/WT (black; n = 5–7). (C) Top: Representative normalized current traces during a depolarizing pulse from a holding potential of −180 mV to −80 mV. Time constant of inactivation for NaVAbΔ40 (red), NaVAbΔ28 (blue), NaVAbΔ10 (green), NaVAbΔ7 (gold), and NaVAbΔ3 (gray); n = 4–11. The inactivation time constants were estimated using the equation yo + A(exp(−t/τ). (D) Time to peak current of the C-terminal truncated constructs, color coded as in C (n = 6–7). Error bars represent SEM.

