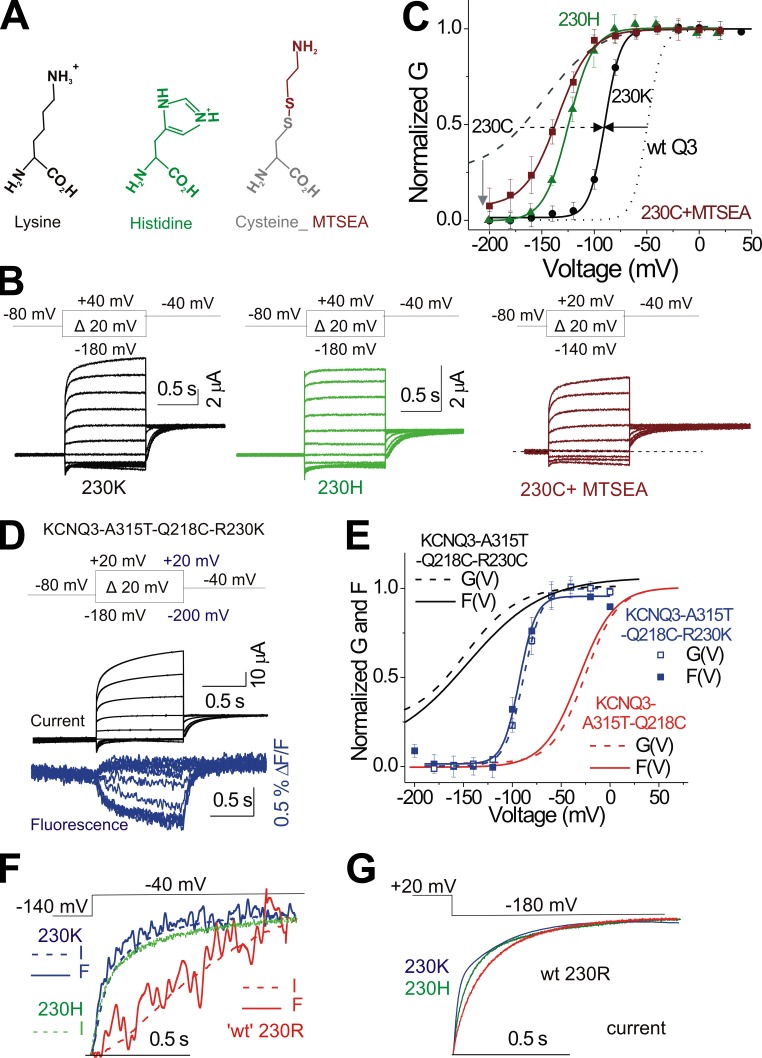
Figure 3.
The loss of the positive charge of R230 accounts for most of the leftward shift in the G(V). (A) Structure of lysine, histidine, and a modified cysteine by the thiol reagent MTSEA. (B) Representative current traces from KCNQ3-A315T-R230K (black), KCNQ3-A315T-R230H (green), and KCNQ3-A315T-R230C after application of MTSEA (1 mM; maroon) for the indicated voltage protocols. External MTSEA was applied by stepping 15 times to +20 mV for 5 s from a holding voltage of −80 mV and then washed away for 15 s before the indicated voltage protocol was applied. Dotted line represents zero current. (C) Extrapolated tail conductances from B were normalized (G(V), see Materials and methods) and plotted versus test voltages (means ± SEM; n = 8–9). Normalized G(V) of KCNQ3-A315T (WT Q3, dotted line) and KCNQ3-A315T-R230C (dashed line) are shown for comparison. (D) Representative current (black) and fluorescence (blue) traces from labeled KCNQ3-A315T-Q218C-R230K for the indicated voltage protocol. (E) Extrapolated tail conductance and fluorescence from D were normalized (see Materials and methods) and plotted versus test voltages (G(V), open squares), and F(V), filled blue squares) of KCNQ3-A315T-Q218C-R230K (means ± SEM, n = 10). For comparison, the tail conductance (dashed lines) and fluorescence (solid lines) fits of KCNQ3-A315T-Q218C-R230C (black) and WT KCNQ3-A315T-Q218C (red), respectively, are shown. Lines represent the fitted theoretical voltage dependencies (see Materials and methods, Eqs. 1 and 2). (F) Comparison of the kinetics of ionic current (dashed lines) and fluorescence (solid lines) signals from KCNQ3-A315T-Q218C-R230K (blue) and WT KCNQ3-A315T-Q218C (red), respectively, in response to the voltage protocol. The time course of ionic current of KCNQ3-A315T-R230H (green) is also shown for comparison. (G) Comparison of deactivation kinetics of ionic current from KCNQ3-A315T-Q218C-R230K (blue), KCNQ3-A315T-Q218C-R230H (green), and WT KCNQ3-A315T-Q218C (red), respectively, in response to the voltage protocol. The same color code for the different KCNQ3 bearing R230x amino acid substitutions is shown throughout the figure.

