Figure 1.
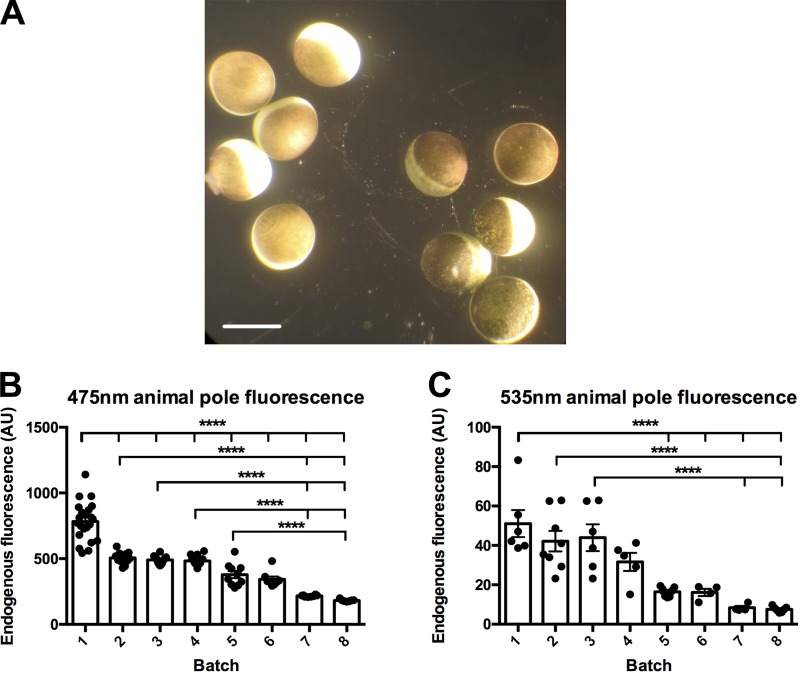
Oocytes are variable in endogenous background fluorescence at multiple wavelengths. (A) X. laevis oocytes from different batches of oocytes. Scale bar, 1 mm. (B) Endogenous background fluorescence of the animal pole excited with a 420-nm LED reflected onto the oocytes by a 455-nm long-pass dichroic through a ×40 water-immersion objective, where the emission was collected through the dichroic and a 475-nm long-pass filter. Batches were placed in order of most endogenous background to least. Batch 1, n = 22; batch 2, n = 1; batch 3, n = 14; batch 4, n = 20; batch 5, n = 10; batch 6, n = 8; batch 7, n = 8; and batch 8, n = 7. A one-way ANOVA together with a post hoc Tukey multiple comparisons test. ****, P < 0.0001. For further information, see Table S1. (C) Endogenous background fluorescence of the animal pole excited with a 470-nm LED that was passed through a filter cube housing a 480/40-nm excitation filter, a 505-nm long-pass dichroic, and a 535/50-nm emission filter. Batches are placed in order of most endogenous background to least. Batch 1, n = 6; batch 2, n = 8; batch 3, n = 6; batch 4, n = 5; batch 5, n = 7; batch 6, n = 4; batch 7, n = 4; and batch 8, n = 7. A one-way ANOVA together with a post hoc Tukey multiple comparisons test. ****, P < 0.0001. For further information, see Table S2. The batch numbers in B and C do not correspond and are different batches of oocytes. The measurements are in comparable optical conditions.

