Figure 3.
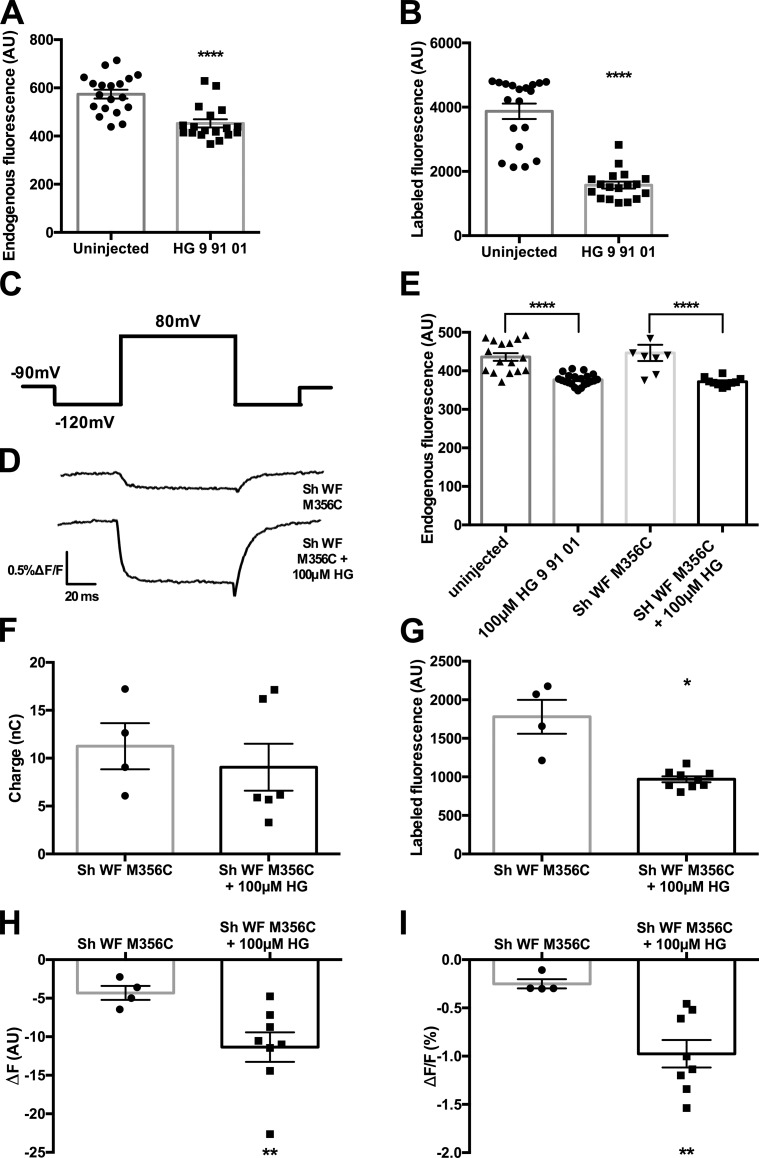
Addition of the SIK inhibitor improves ATTO 425 signal. (A) A comparison of uninjected (n = 19) and 100 µM HG 9-91-01–injected (n = 18) oocytes on day 4 before labeling with ATTO 425. (B) ****, P < 0.0001 after labeling with ATTO 425, unpaired two-tailed t tests. (C) Pulse protocol for ATTO 425 fluorescence, where the oocytes were held at −90 mV and prepulsed to −120 mV for 60 ms, followed by an 80-ms pulse to 80 mV, with a post pulse of 120 mV for 60 ms before returning to the holding potential. (D) Representative trace of fluorescence data of ATTO 425–labeled Shaker W434F M356C (top) and ATTO 425 labeled Shaker W434F M356C + 100 µM HG 9-91-01 (bottom) oocytes with the pulse protocol from A. (E) Endogenous oocyte fluorescence on day 3 was checked for several conditions (uninjected, n = 16; construct, n = 8; HG 9-91-01, n = 21; construct + HG 9-91-01, n = 10). ****, P < 0.0001, ordinary one-way ANOVA with a post hoc Bonferroni multiple comparisons test. (F) Comparisons of levels of expressions in Shaker W434F M356C (n = 4) and Shaker W434F M356C + HG 9-91-01 (n = 6) injected oocytes. Unpaired two-tailed t test showed no statistical significance (P = 0.5414). (G) Comparison of background fluorescence of ATTO 425–labeled oocytes Shaker W434F M356C (n = 4) and Shaker W434F M356C + HG 9-91-01 (n = 8). *, P = 0.0324, unpaired two-tailed t test. (H) Comparisons of fluorescence signal in oocytes injected with Shaker W434F M356C (n = 4) and Shaker W434F M356C + HG 9-91-01 (n = 8). **, P = 0.0085, unpaired two-tailed t test. (I) Comparison of ΔF/F % in oocytes injected with Shaker W434F M356C (n = 4) and Shaker W434F M356C + HG 9-91-01 (n = 8). **, P = 0.0011, unpaired two-tailed t test. For further information, see Tables S6–S12. All error bars are ±SEM centered on the mean.

