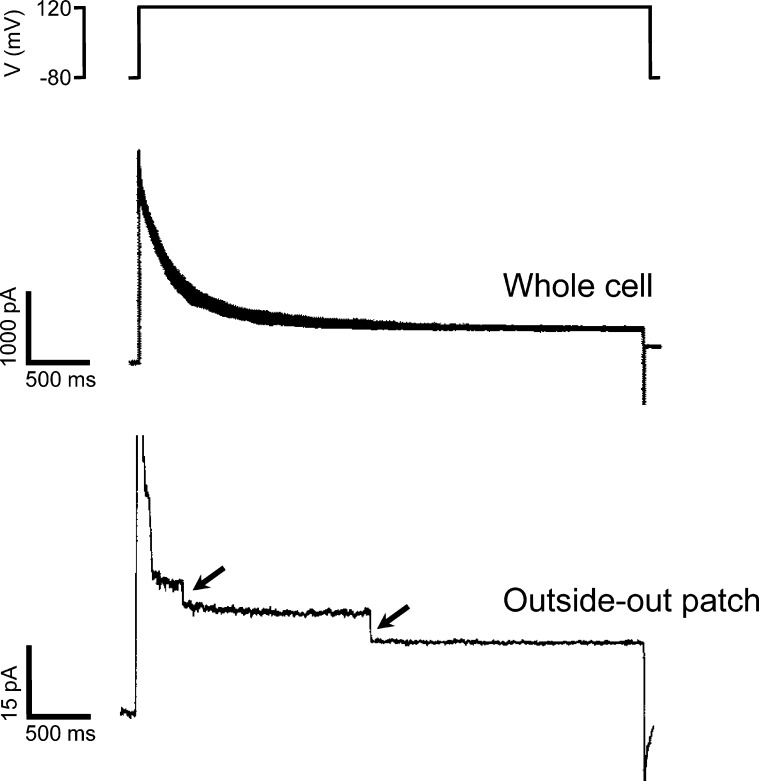
Figure 2.
Examples of VRAC single-channel currents in a C6 glioma cell. Top panel shows membrane voltage. Middle panel shows voltage-dependent inactivation of whole-cell current induced by stepping membrane voltage from −80 to 120 mV. Bottom panel shows voltage-dependent current inactivation in an outside-out membrane patch stepped from a membrane voltage of −80 to 120 mV. Arrows show closing of single VRAC channels. Figure is modified from Jackson and Strange (1995b).

