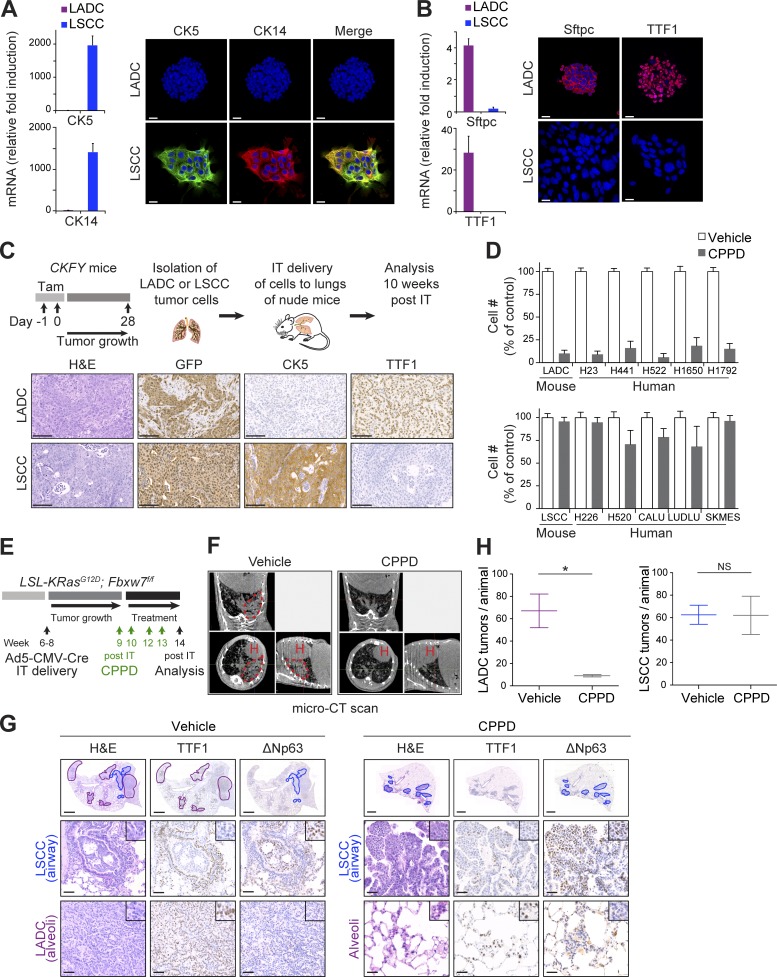
Figure 3.
LSCC tumors are resistant to the chemotherapeutic agent cisplatin. (A) LADC and LSCC cells were isolated from CKFY mice 4 wk after tamoxifen injection, and CK5 and CK14 expression was analyzed by qPCR and immunostaining. n = 2 independent isolations. Bars, 20 µm. (B) Sftpc and TTF1 expression in CKFY LADC and LSCC cells (n = 2 independent isolations) was analyzed by qPCR and immunostaining. Bars, 20 µm. (C) Top: Scheme summarizing the protocol used to isolate LADC and LSCC cells from CKFY mice and to validate their tumoral properties in nude mice. Bottom: Representative IHC staining of lung tumor sections derived from isolated LADC and LSCC tumor cells (n = 2 independent isolations) after intratracheal (IT) injection. CKFY-derived, LSCC, and LADC tumor cells were identified by GFP, CK5, and TTF1, respectively. Bars, 100 µm. Tam, tamoxifen. (D) LADC, but not LSCC, cells from CKFY mice and human tumor cell lines are highly sensitive to cisplatin (CPPD) treatment (n = 4 independent experiments). (E) 9–11 wk after Ad5-CMV-Cre infection, KF mice were treated with PBS or cisplatin (7 mg/kg) and monitored for response. (F) In vivo imaging by micro-computed tomography (micro-CT) of the lungs of animals treated as in E after 4–5 wk of treatment. Images representative of two animals. H, heart; dotted line, tumor mass. (G) Lung histology of animals treated as in E, showing both LADC (TTF1+) and LSCC (ΔNp63+) tumors in mice receiving vehicle but only LSCC in mice receiving cisplatin. Images representative of two animals. (H) Quantification of LADC and LSCC tumors per animal in control and cisplatin-treated mice. n = 2 animals per condition. Plots indicate mean and range; Student’s one-tailed t test was used to calculate P values (*, P = 0.0305). See also Fig. S4.

