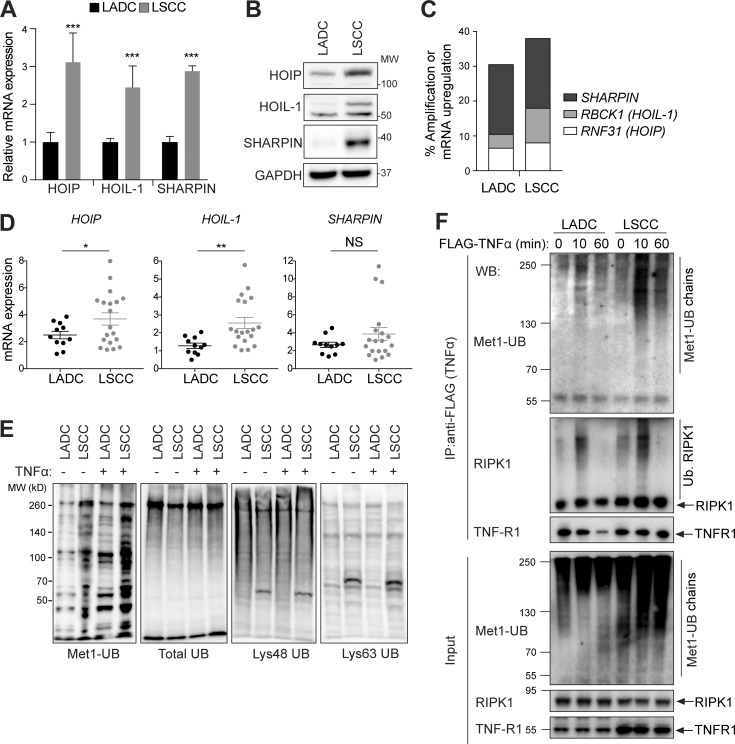
Figure 4.
LUBAC expression and linear ubiquitylation are increased in LSCC compared with LADC cells. (A) Relative mRNA expression of LUBAC components in LSCC and LADC murine cells from KF mice, measured by real-time PCR. Student’s two-tailed t test was used to calculate P values (***, P ≤ 0.0001). Graph shows mean + SD of six experiments. (B) Immunoblots showing the abundance of the three LUBAC components HOIP (RNF31), HOIL-1, and Sharpin, in LADC and LSCC cells from the KF mouse model. Blots representative of four independent experiments. MW, molecular weight. (C) TCGA data from http://www.cbioportal.org showing frequency of alterations in genes encoding LUBAC components in human LSCC and LADC. n = 230 LADC, 179 LSCC samples. (D) Relative mRNA expression of LUBAC components in LSCC (n = 19) and LADC (n = 11) patient samples from the Cordoba Biobank, measured by real-time PCR. The P value was calculated using the Student’s t test (*, P = 0.036; **, P = 0.0029). Plots indicate mean ± SEM. (E) Immunoblots of different polyubiquitin chains in whole-cell lysates from untreated (no exogenous stimulation) or TNFα-stimulated LADC and LSCC cells from KF mice. (F) TNFR1 complex I immunoprecipitated (IP) from KF LADC and LSCC cells using Flag-tagged TNFα under nondenaturing conditions and immunoblotted with Met1-Ub–specific antibodies. Blots representative of two independent experiments. WB, Western blot. See also Fig. S4.

