Figure 7.
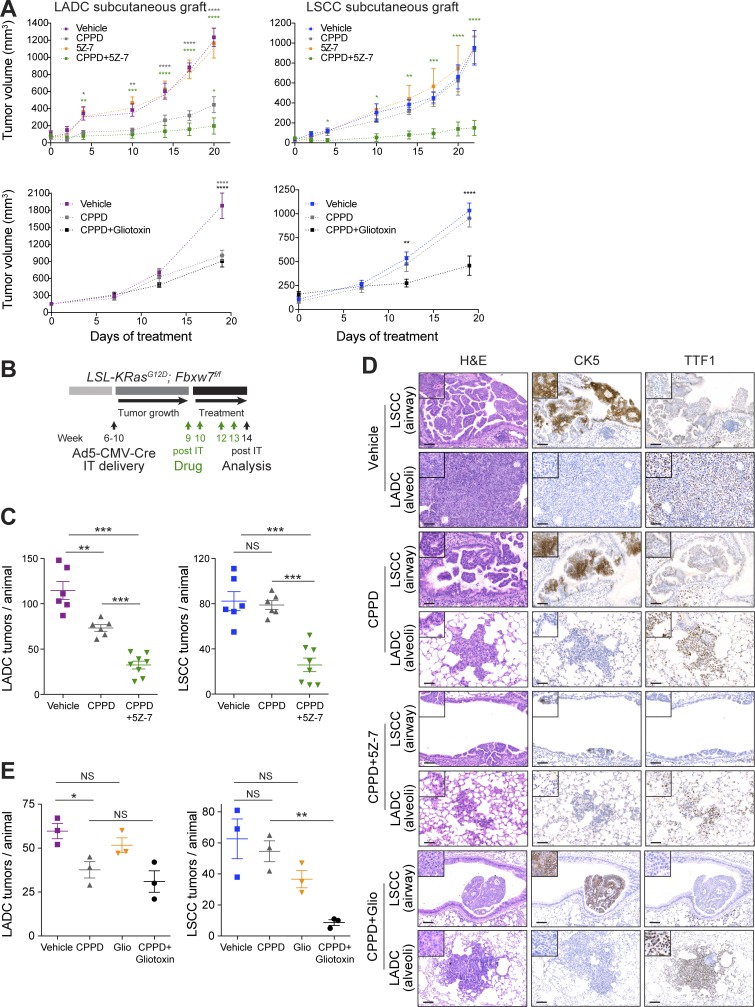
Combination treatment with cisplatin and TAK1 inhibitor or gliotoxin sensitizes LSCC tumors. (A) In vivo tumor graft growth curves of LADC and LSCC cells subcutaneously injected in both flanks of athymic NU/NU mice. Mice with palpable tumors were treated with i.p. injections as follows. Top: Cisplatin (CPPD; n = 3), 5Z-7-oxozeaenol (n = 3), 5Z-7-oxozeaenol+cisplatin (n = 3), or vehicle (n = 3). Bottom: Cisplatin (n = 3), gliotoxin+cisplatin (n = 4), or vehicle (n = 4). Data are mean ± SEM of the tumor volumes. P values calculated from two-way ANOVA. *, P < 0.05; **, P < 0.01; ***, P < 0.001; ****, P < 0.0001 versus vehicle. (B) Scheme depicting experimental design for in vivo test of cisplatin (3.5 mg/kg) alone or in combination with 5Z-7-oxozeaenol (7 mg/kg) or gliotoxin (2.5 mg/kg). (C) Quantification of LADC and LSCC tumors per animal in control, cisplatin-treated, and 5Z-7 combination-treated KF mice. P values calculated using two-way ANOVA (n = 6 vehicle and cisplatin, n = 8 combination). **, P = 0.009; ***, P < 0.001. Plots show mean ± SEM. (D) Histological analysis of LADC and LSCC tumors in control, cisplatin-treated, and combination-treated animals. Representative of animals in C (vehicle, cisplatin, and 5Z-7 combination) and E (gliotoxin combination). Bars, 50 µm. (E) Quantification of LADC and LSCC tumors per animal in control, cisplatin-treated, and gliotoxin combination–treated KF mice. P values calculated using two-way ANOVA (n = 3 each treatment; *, P = 0.031; **, P = 0.0013). Plots show mean ± SEM. See also Fig. S5.

