Figure 7.
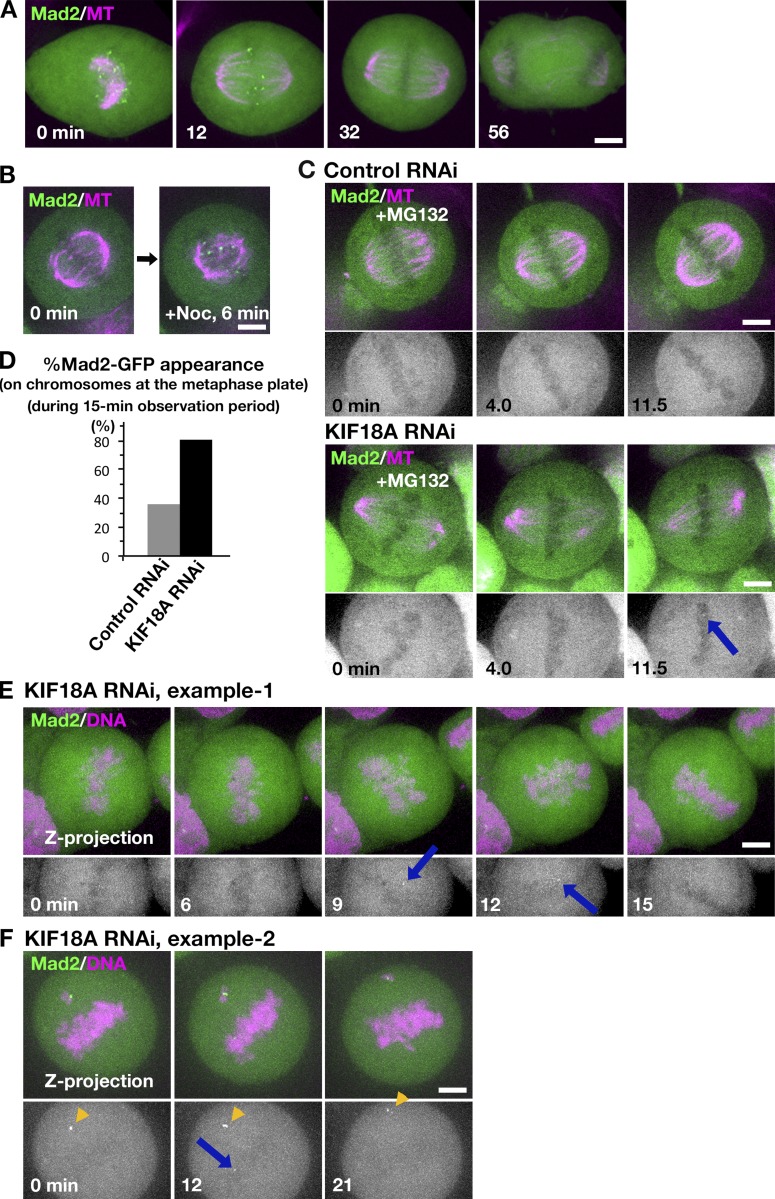
GFP-Mad2 dynamics in the absence of KIF18A in HeLa cells. (A) GFP-Mad2 localization during mitosis in the control HeLa cell. Images were acquired from 11 z sections (separated by 2 µm) and are displayed after maximum projection. (B) Accumulation of GFP-Mad2 on kinetochores upon MT depolymerization by nocodazole. Image was acquired every 30 s at a single focal plane. (C) Metaphase-arrested cells were imaged every 30 s at a single focal plane after control or KIF18A RNAi. Arrows indicate the appearance of a punctate GFP-Mad2 signal at the metaphase plate. (D) Frequency of the cells in which GFP-Mad2 appeared on chromosomes at the metaphase plate during the 15-min observation period. n = 47 for each. (E and F) GFP-Mad2 appearance at the metaphase plate in KIF18 RNAi-treated cells (arrows). As a reference, brighter GFP-Mad2 signals on persistently unaligned chromosomes are shown in F (arrowheads). Maximum projection images are shown. Bars, 5 µm.

