Figure 2.
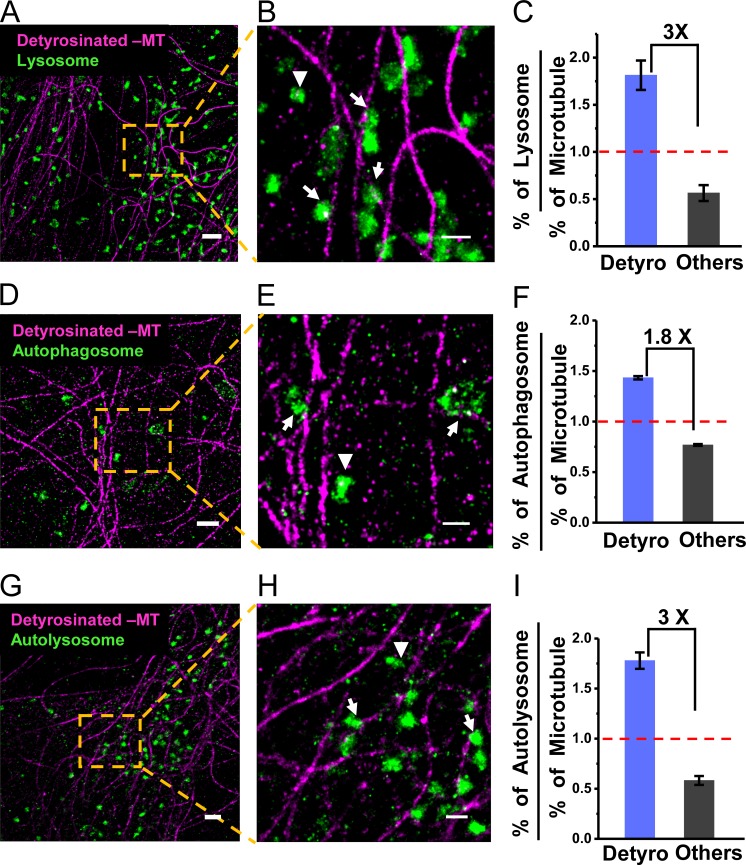
Lysosomes, autophagosomes, and autolysosomes are enriched on detyrosinated microtubules. Two-color super-resolution images showing lysosomes (green; A and B), autophagosomes (green; D and E), and autolysosomes (green; G and H) together with detyrosinated microtubules (magenta). Arrows and arrowheads indicate examples of lysosomal, autophagosomal, or autolysosomal compartments, associated and not associated with detyrosinated microtubules, respectively. Quantification of the percentage of lysosomes (C), autophagosomes (F), and autolysosomes (I) associated with detyrosinated or other microtubule subpopulations normalized to the percentage of the respective microtubule subpopulations. The bars and error bars represent the median and SD, respectively, for three different cells analyzed in each case. The total number of lysosomes analyzed, n = 1,316 (on Detyro = 818, others = 498); for autophagosomes, n = 210 (on Detyro = 105, others = 105); and for autolysosomes, n = 302 (on Detyro = 185, others = 117). Bars, 1 µm for A, D, and G, and 500 nm for B, E, and H.

