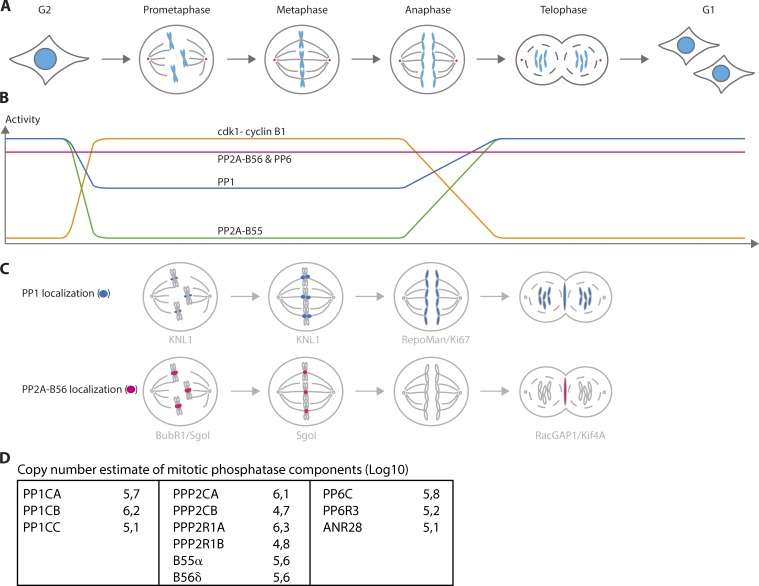
Figure 1.
Cell division and the activity and localization of mitotic phosphatases. (A) An overview of the different stages of mitosis and the movement of chromosomes. (B) Activity profile of mitotic phosphatases and Cdk1 in relation to mitotic progression. To a large extent, these activity profiles are hypothetical and will depend on substrate and localization. (C) Localization patterns of PP1 (blue) and PP2A-B56 complexes (red) during cell division in human cells. (D) Copy number estimates of mitotic phosphatase components based on proteomic data from HeLa cells (Bekker-Jensen et al., 2017). For simplicity, only the isoform with the highest expression level is shown for B55, B56, PPP6R, and ANR subunits.

