Figure 2.
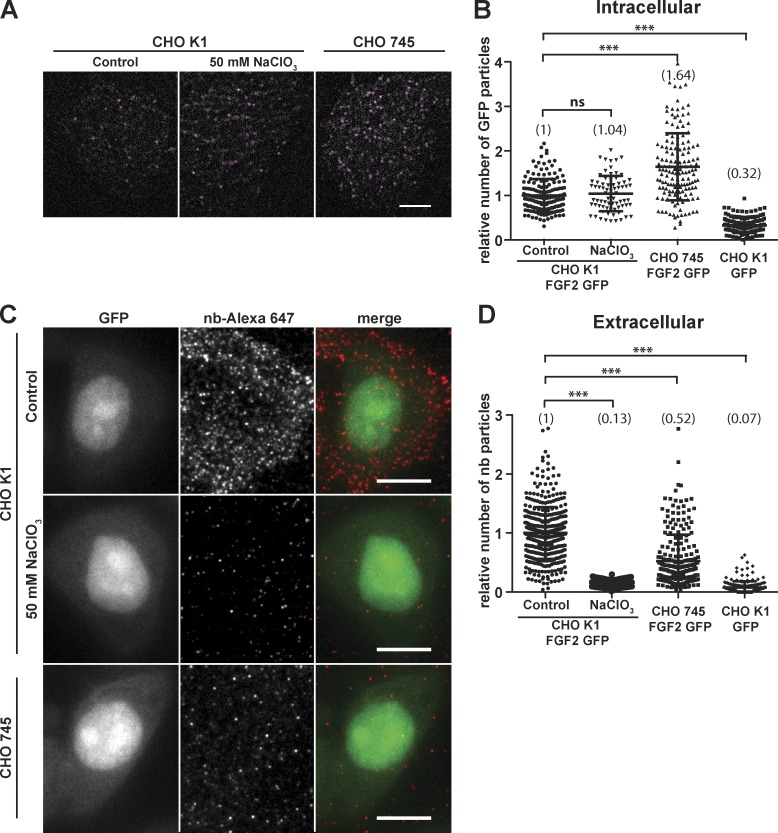
Unconventional secretion of FGF2-GFP depends on cell surface heparan sulfate proteoglycans. (A) Individual FGF2-GFP particles at the inner plasma membrane leaflet were imaged based on GFP fluorescence using TIRF microscopy as described in the legend to Fig. 1 and in Materials and methods. This analysis included CHO-K1 WT cells (control; a), CHO-K1 WT cells treated with 50 mM NaClO3 to inhibit post-translational sulfation (b), and CHO-745 mutant cells that express only the core protein without heparan sulfate chains (c). For each condition indicated, the first frame of TIRF videos is shown. Individual particles were identified using the TrackMate Fiji plugin (circles). Bar, 10 µm. (B) Quantification of FGF2-GFP particles at the inner plasma membrane leaflet under the conditions shown in A. TIRF videos of 300 frames (80 ms/frame) were analyzed using the plugin TrackMate (n > 70 cells per condition). The mean values of each condition are shown in brackets with FGF2-GFP set to 1. The statistical analysis was based on a one-way ANOVA test combined with Tukey’s post hoc test (ns, P ≥ 0.05; ***, P ≤ 0.001). (C) Individual FGF2-GFP particles on cell surfaces were imaged using fluorescent anti-GFP nanobodies. This analysis was done under the same experimental conditions shown in A. Cells were induced to express FGF2-GFP for 24 h followed by incubation with Alexa Fluor 647–labeled anti-GFP nanobodies for 30 min on ice. Cells were fixed, and images were acquired using both wide-field (GFP fluorescence) and TIRF microscopy (FGF2-GFP cell surface population). Bar, 10 µm. (D) Quantification of individual FGF2-GFP particles on cell surfaces under the conditions described in the legend to C. Data were processed using the Fiji plugin TrackMate (n > 144 cells per condition). For each condition, the mean value is shown in brackets with FGF2-GFP set to 1. The statistical analysis was based on a one-way ANOVA test combined with Tukey’s post hoc test (***, P ≤ 0.001).

