Figure 3.
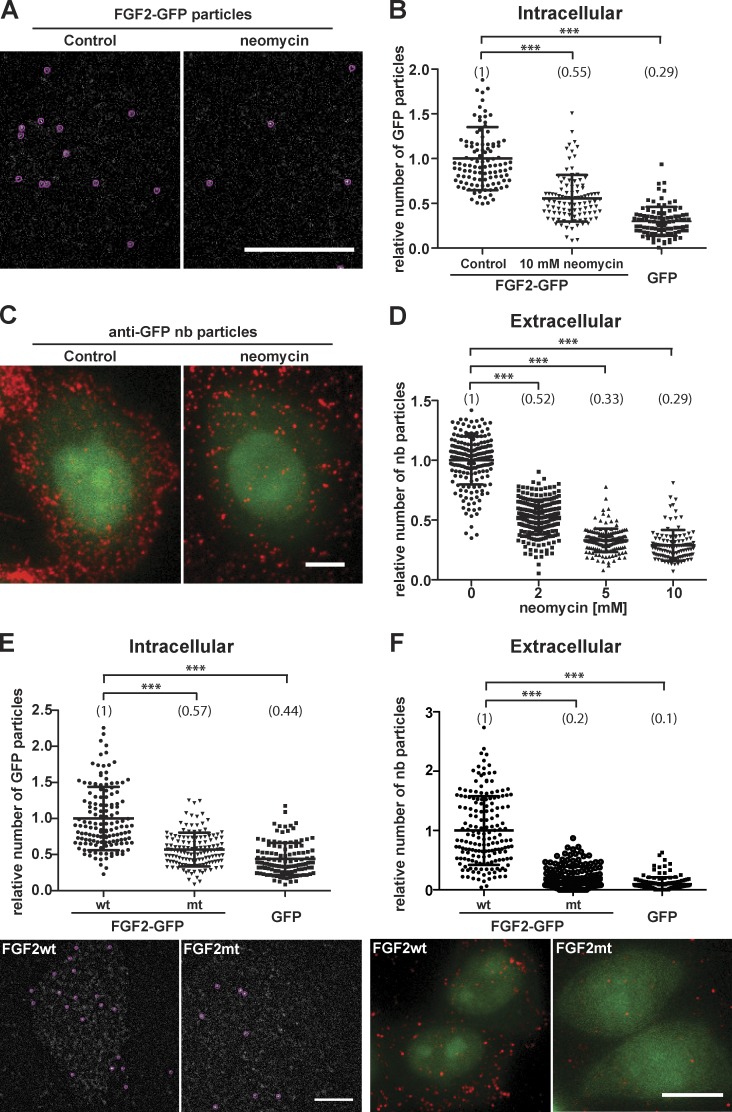
FGF2 membrane recruitment and translocation to cell surfaces depend on interactions of FGF2 with PI(4,5)P2 at the inner leaflet. (A) CHO-K1 cells were imaged expressing FGF2-GFP at low levels to allow for single particle detection. Where indicated, cells were treated for 3 h with 10 mM neomycin. Single FGF2-GFP particles were identified at the inner plasma membrane leaflet (red circles). The first frames of TIRF videos are shown. Bar, 6 µm. (B) Quantification of FGF2-GFP recruitment at the inner leaflet of the plasma membrane under the conditions shown in A. TIRF videos of CHO-K1 cells expressing FGF2-GFP were acquired (300 frames; 80 ms/frame). The number of GFP particles at the inner plasma membrane leaflet was quantified using the Fiji plugin TrackMate (n > 95 cells per condition). The mean value of FGF2-GFP particles for each condition is given in brackets with the control set to 1. The statistical analysis was based on a one-way ANOVA test combined with Tukey’s post hoc test (***, P ≤ 0.001). (C) Identification of single FGF2-GFP particles at the outer plasma membrane leaflet. CHO-K1 cells expressing FGF2-GFP were cultivated in the presence or absence of 5 mM neomycin as indicated. Following incubation for 24 h in the presence of doxycycline to induce FGF2-GFP expression, intact cells were stained for FGF2-GFP on cell surfaces using anti-GFP nanobodies coupled to Alexa Fluor 647. Afterward, cells were fixed and imaged using both wide-field (green channel) and TIRF microscopy (red channel), the latter identifying single FGF2-GFP particles on cell surfaces. Bar, 6 µm. (D) Quantification of single FGF2-GFP particles on cell surfaces under the conditions shown in C including a titration of neomycin at 2, 5, and 10 mM. Raw data were analyzed using the Fiji plugin TrackMate (n > 108 cells per condition). The mean value of FGF2-GFP particles on cell surfaces for each condition is given in brackets with the control set to 1. The statistical analysis was based on a one-way ANOVA test combined with Tukey’s post hoc test (****, P ≤ 0.0001). (E) CHO-K1 cells were induced to express either FGF2-GFP, FGF2mt-GFP, a secretion deficient variant form of FGF2-GFP (C77/95A, Y81F; KRK128/129/133QQQ), or GFP at levels that allow for single-particle detection at the inner plasma membrane leaflet. Time series of 300 frames (80 ms/frame) were acquired, and for each condition, single particles were identified and quantified. The first frames of TIRF videos are displayed. (Bar, 6 µm). The mean value of FGF2-GFP particles at the inner leaflet for each condition is given in brackets with the control set to 1. The statistical analysis was based on a one-way ANOVA test combined with Tukey’s post hoc test (***, P ≤ 0.001). (F) CHO-K1 cells were induced for 24 h with doxycycline to express either FGF2-GFP, FGF2mt-GFP, a secretion-deficient variant form of FGF2-GFP (C77/95A, Y81F; KRK128/129/133QQQ), or GFP. Intact cells were stained for FGF2-GFP on cell surfaces using anti-GFP nanobodies coupled to Alexa Fluor 647. Afterward, cells were fixed and imaged using both wide-field (green channel) and TIRF microscopy (red channel), the latter identifying single FGF2-GFP particles on cell surfaces (bar, 6 µm). The number of single particles on cell surfaces was analyzed using the Fiji plugin TrackMate (n > 95 cells per condition). The mean value for each condition is displayed in brackets with the WT form of FGF2-GFP set to 1. The statistical analysis was based on a one-way ANOVA test combined with Tukey’s post hoc test (***, P ≤ 0.001).

