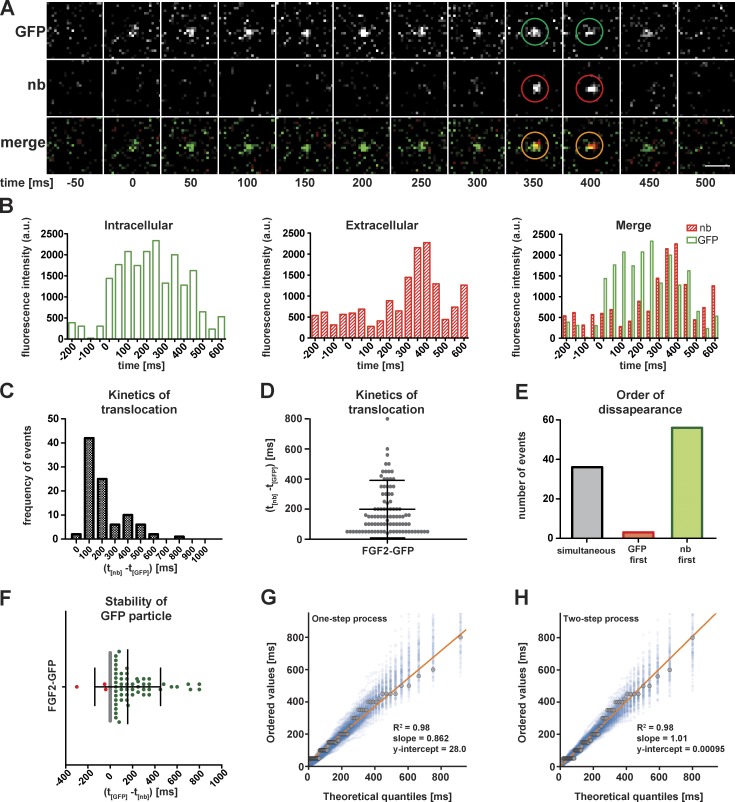
Figure 4.
Direct visualization of individual events of FGF2 membrane translocation to the cell surface of living cells. (A) Representative example of a FGF2-GFP membrane recruitment and translocation event. TIRF imaging was performed on living cells expressing FGF2-GFP in the presence of Alexa Fluor 647–labeled anti-GFP nanobodies to detect extracellular FGF2-GFP. Successive frames (50 ms/frame) from a zoomed-in area of interest are shown. The time point of FGF2-GFP membrane recruitment was set to 0. Bar, 1 µm. (B) Bar histograms of the fluorescence intensity of the FGF2-GFP translocation event shown in A as a function of time. (C and D) A total of 95 FGF2-GFP translocation events were analyzed. The time intervals between the appearance of FGF2-GFP particles within the evanescent field and nanobody binding at the cell surface were calculated (t(nb) − t(GFP)). The distribution of observed time intervals was plotted. (E) FGF2-GFP translocation events from C and D were classified into three categories depending on the order of disappearance of GFP and Alexa Fluor 647 nanobody (nb) particles following completion of FGF2-GFP membrane translocation: (a) FGF2-GFP and Alexa Fluor 647 nanobody particles disappear simultaneously (gray), (b) GFP particles disappear before Alexa Fluor 647 nanobody particles (red), and (c) Alexa Fluor 647 nanobody particles disappear before GFP particles (green). (F) For each translocation event from C and D, the duration of GFP fluorescence remaining after nanobody disappearance in the observed position was calculated. The color code corresponds to what is shown in E. (G and H) Probability plots used to test whether one- or two-step exponential processes fit the time intervals measured between FGF2-GFP recruitment at the inner leaflet and the appearance of single FGF2-GFP molecules at the outer plasma membrane leaflet as detected by binding of anti-GFP nanobodies. Black dots correspond to measured data. The blue dots are the outcome of stochastic simulations with the hypothesized probability distribution for each case.

