Figure 2.
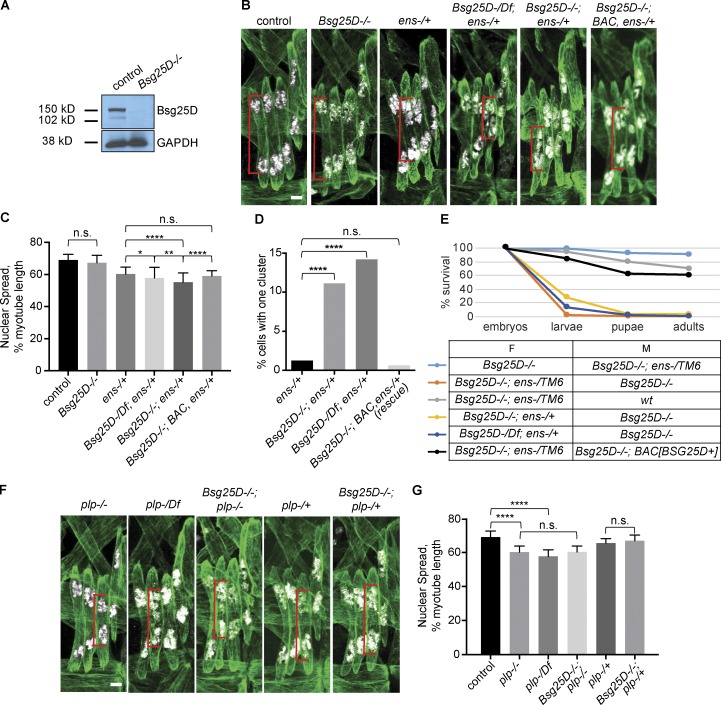
Bsg25Dgenetically interacts with ens, but not plp. (A) Western blot showing loss of Bsg25D protein in Bsg25D−/− larval lysates. (B) Extended-focus projections of representative stage 16 hemisegments from indicated genotypes. (C) Bar graph showing mean nuclear spread and SD. For each genotype, n (number of hemisegments) is control, n = 39; Bsg25D−/−, n = 61; ens−/+, n = 46; Bsg25D-/Df;ens−/+, n = 43; Bsg25D;ens−/+, n = 71; Bsg25D−/−;BAC, ens−/+, n = 44. P values were calculated by Student’s t test. (D) Graph showing the percentage of myotubes that have a single nuclear cluster. P values were calculated by Fisher’s exact test from contingency tables comparing ens-/+ to each other genotype. n values (number of myotubes for each genotype) are ens−/+, 239; Bsg25D−/−;ens−/+, 296; Bsg25D-/Df;ens−/+, 176; Bsg25D−/−;BAC, ens−/+ (rescue), 160. (E) Viability graph showing survival during development for individuals derived from indicated crosses. The following number of individuals were included for each genotype: Bsg25D−/−×Bsg25D−/−;ens−/TM6, 140; Bsg25D−/−;ens-/TM6×Bsg25D−/−, 153; Bsg25D−/−;ens-/TM6×wt, 140; Bsg25D−/−;ens−/+×Bsg25D−/−, 113; Bsg25D-/Df;ens−/+×Bsg25D−/−, 148; Bsg25D−/−;ens-/TM6×Bsg25D−/−;BAC[Bsg25D+], 144. F, female; M, male. (F) Extended-focus projections of representative stage 16 hemisegments from indicated genotypes. (G) Bar graph showing mean nuclear spread and SD. For each genotype, number of hemisegments is plp−/−, n = 47; plp-/Df, n = 24; Bsg25D−/−; plp−/−, n = 39; plp-/+, n = 34; Bsg25D−/−;plp-/+, n = 29. P values were calculated by Student’s t test. The control data in G are the same as in C; for representative image, see first panel in B. *, P < 0.05; **, P < 0.01; ****, P < 0.0001. In all confocal images, red brackets indicate sample nuclear spread measurements. Tropomyosin, green; nuclei, white. Scale bars = 5 µm.

