Figure 3.
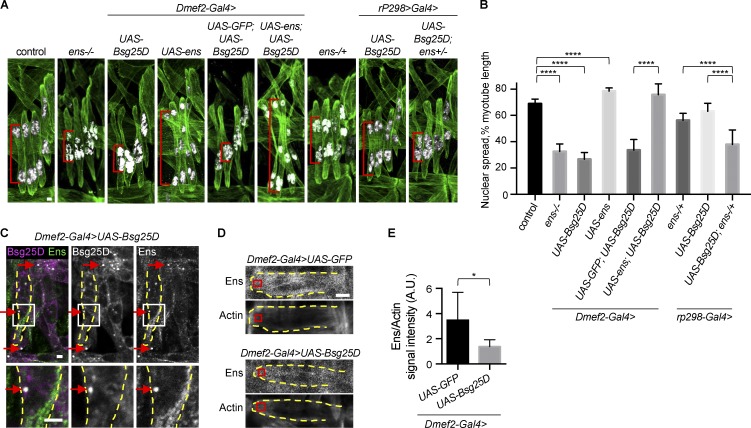
Overexpressed Bsg25D causes nuclear positioning defects in embryonic myotubes by sequestering endogenous Ens. (A) Extended-focus projections of representative stage 16 hemisegments from indicated genotypes. Green, Tropomyosin; white, nuclei. Red brackets indicate sample nuclear spread measurements. (B) Bar graph showing mean nuclear spread and SD. For each genotype, the number of hemisegments is as follows: control, n = 22; Dmef2-Gal4>UAS-Bsg25D, n = 34; Dmef2-Gal4>UAS-ens, n = 47; Dmef2-Gal4>UAS-GFP:UAS-Bsg25D, n = 25; Dmef2-Gal4>UAS-ens;UAS-Bsg25D, n = 42; ens−/+, n = 37; rP298-Gal4>UAS-Bsg25D, n = 33; rP298-Gal4>UAS-Bsg25D;ens−/+, n = 37. Control data and the representative image are the same as in Fig. 2. ****, P < 0.0001. (C) Immunofluorescent antibody staining for Bsg25D and Ens in an embryo overexpressing Bsg25D. Arrows show examples of colocalization. Dashed yellow lines outline a lateral transverse myotube. In the merged image: magenta, Bsg25D; green, Ens; white, colocalization. Images in the bottom row are higher magnification views of boxed regions. (D) Representative images of stage 16 VL1 myotubes from indicated genotypes. Each image is a single slice from a confocal stack. Red boxes show where the signal intensity was quantified. (E) Graph showing Ens intensity, normalized to actin intensity. Number of myotubes is six for both genotypes, mean ± SD. *, P < 0.05. Scale bars = 2 µm (A and C) and 5 µm (D).

