Figure 4.
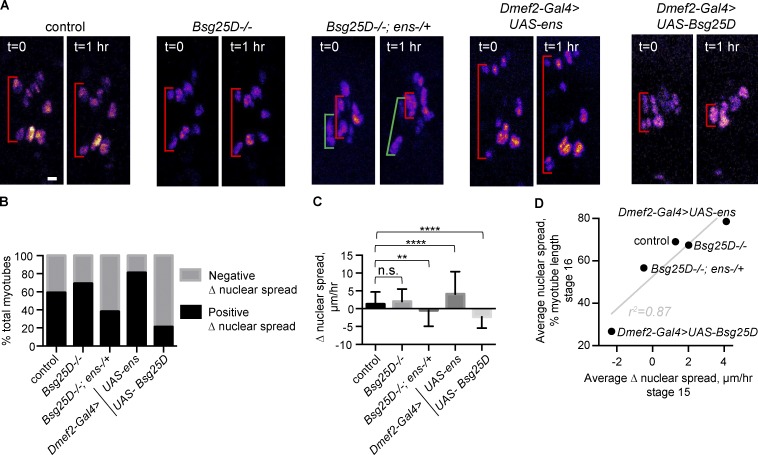
Dynamics of myonuclear cluster separation are affected by levels of Bsg25D and Ens. (A) First and last frames from time-lapse series of myonuclear movement during stage 15 in indicated genotypes. Red brackets show change in nuclear spread over time. In Bsg25D−/−;ens−/+ images, green and red brackets show adjacent myotubes undergoing opposite Δ nuclear spreads. All images are extended focus projections of Z-stacks. Nuclei are multicolored. Scale bar = 5 µm. (B) Graph showing percentages of myotubes undergoing positive versus negative Δ nuclear spread during stage 15. (C) Mean and SD of Δ nuclear spread during stage 15. For each genotype in B and C, the number of myotubes is as follows: control, n = 112; Bsg25D−/−, n = 72; Bsg25D−/−;ens−/+, n = 86; Dmef2-Gal4>UAS-ens, n = 85; Dmef2-Gal4>UAS-Bsg25D, n = 62. P values were calculated by Student’s t test. **, P < 0.01; ****, P < 0.0001. (D) Correlation between stage 15 mean Δ nuclear spread and stage 16 mean nuclear spread in fixed samples. Linear regression line is in gray; r2 is the coefficient of determination.

