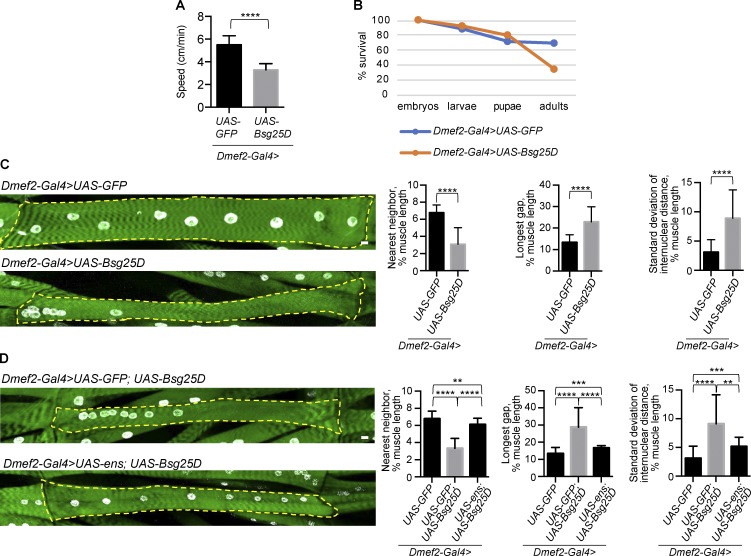
Figure 5.
Bsg25D overexpression induces nuclear positioning defects in larval myofibers that can be rescued by Ens. (A) Larval motility in larvae overexpressing either GFP (control) or Bsg25D in muscle. For Dmef2-Gal4>UAS-GFP, n = 30 larvae. For Dmef2-Gal4>UAS-Bsg25D, n = 12 larvae. P values were calculated by Student’s t test. (B) Viability graph showing survival during development. n = 100 individuals for each genotype. (C and D) Representative extended focus projections of stained myofibers and nuclear positioning analyses. Green, phalloidin; white, nuclei. Dashed yellow line outlines individual myofibers. Scale bars = 10 µm. Graphs depict mean and SD for three methods for quantifying myonuclear positioning (see Materials and methods). For each genotype, the same images were analyzed with each method. For Dmef2-Gal4>UAS-GFP, n = 40 myofibers. For Dmef2-Gal4>UAS-Bsg25D, n = 45. For Dmef2-Gal4>UAS-GFP;UAS-Bsg25D, n = 23; Dmef2-Gal4>UAS-ens;UAS-Bsg25D, n = 19. Dmef2-Gal4>UAS-GFP data are the same in C and D. P values were calculated by Student’s t test. **, P < 0.01; ***, P < 0.001; ****, P < 0.0001.

