Figure 6.
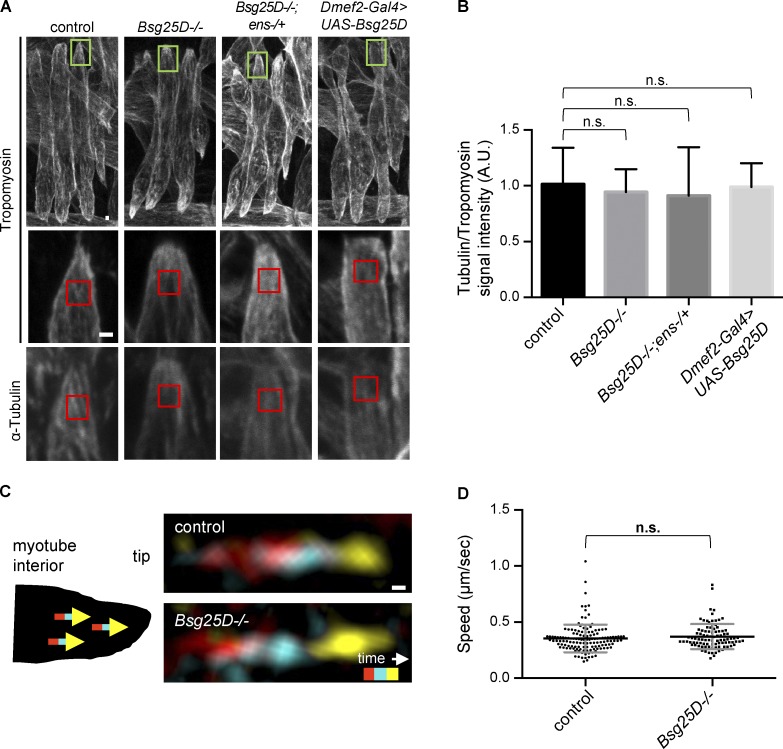
MT density and dynamics are normal in Bsg25D−/− embryonic myotubes. (A) Representative extended-focus projections of Tropomyosin and α-Tubulin signal in stage 16 lateral transverse myotubes. Green boxes in the top row indicate muscle tips magnified in the second and third rows. Red boxes represent regions where signal intensity was quantified. Scale bar = 1 µm. (B) Bar graph showing the mean and SD of the ratio of Tubulin to Tropomyosin signal for indicated genotypes. The number of embryos for each genotype is as follows: control, n = 9; Bsg25D−/−, n = 14; Bsg25D−/−;ens-/+, n = 11; Dmef2-Gal4>UAS-Bsg25D, n = 14. P values were calculated by Student’s t test. The entire experiment was performed twice with similar results; images and graph are from one replicate. (C) Representative EB1-YFP comets for indicated genotypes. Schematic shows that comets run toward myotube tips. Images were generated by merging three frames from a time-lapse series, pseudocolored red (t1 = 0 s), cyan (t2 = 1.6 s), and yellow (t3 = 3.2 s). Scale bar = 0.1 µm. (D) Scatter plot showing mean speed ± SD (micrometers per second) of EB1-YFP comets. The number of EB1-YFP comets for each genotype is as follows: control, n = 140; Bsg25D−/−, n = 94. P value was calculated by Student’s t test.

