Figure 7.
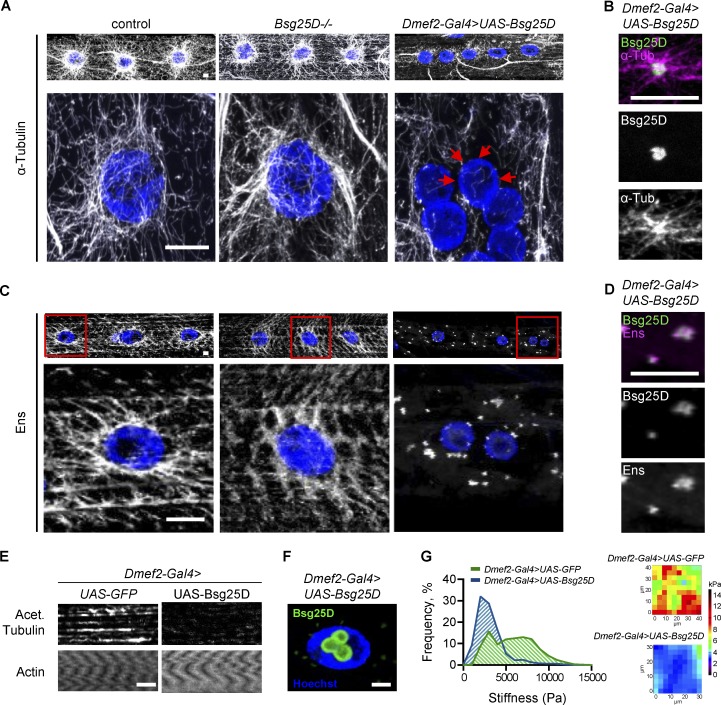
Bsg25D overexpression perturbs normal MT organization and forms Ens-positive MTOCs in larval myofibers. (A) Top: α-Tubulin signal in extended-focus projections of larval myofibers. Bottom: Higher magnification images of nuclear MT arrays. Gray, α-Tubulin; blue, nuclei. Red arrows show myonuclear envelope without MTs. (B) Extended-focus projections of Bsg25D and α-Tubulin signal in a cytoplasmic Bsg25D punctum in Dmef2-Gal4>UAS-Bsg25D larval myofiber. Bsg25D, green; α-Tubulin, magenta; colocalization, white. (C) Top: Ens signal in extended-focus projections of larval myofibers of indicated genotypes. Bottom: Higher magnification images of nuclei delineated by red boxes. Gray, Ens; blue, nuclei. (D) Extended-focus projections of Bsg25D and Ens signal in a cytoplasmic Bsg25D punctum in Dmef2-Gal4>UAS-Bsg25D larval myofiber. Bsg25D, green; Ens, magenta; colocalization, white. (E) Staining of larval myofibers with phalloidin (labeling Actin) and an antibody against acetylated Tubulin. Images are single slices from Z-stacks, immediately below myonuclei. Staining for actin confirms the presence of intact myofibers. (F) Single slice through a Dmef2-Gal4>UAS-Bsg25D myofiber nucleus. Blue, Hoechst; green, Bsg25D. In all images, scale bars = 10 µm. In B, D, and F, Bsg25D localization is visualized by Eos, which fluorescently tags the N-terminus of overexpressed Bsg25D. (G) Left: Frequency histogram of all stiffness measurements from AFM for indicated genotypes. For Dmef2-Gal4>UAS-GFP, n = 21 myofibers. For Dmef2-Gal4>UAS-Bsg25D, n = 16 myofibers. In each genotype, multiple measurements were taken per myofiber; see materials and methods. P value was calculated by Student’s t test: ****, P < 0.0001. Right: Examples of an AFM force map for each genotype.

