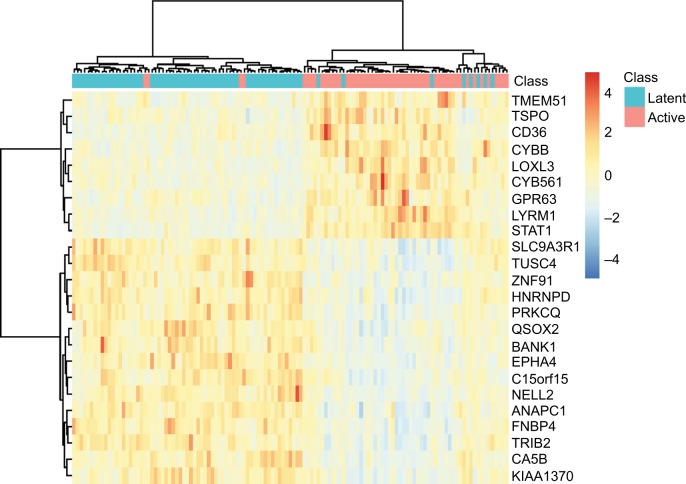
Figure 2.
The heatmap of the 24 signature genes latent and active TB patients.
Notes: The rows represent genes while the columns represent patients. The green and red columns represent latent and active TB patients, respectively. It can be seen that the latent and active TB patients were clustered into different groups.
Abbreviation: TB, tuberculosis.

