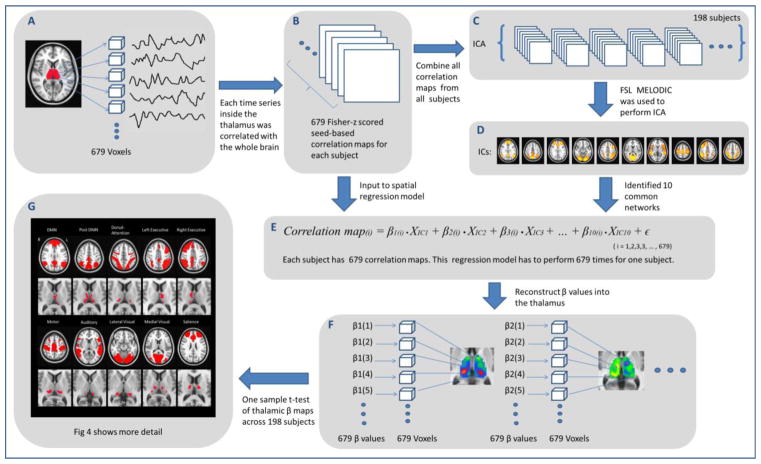
Figure 2.
Schematic flow of thalamocortical functional connectivity analysis. Step A: time series from the thalamus mask (679 voxels in total) were extracted. Step B: each time series from each voxel of the thalamus was correlated to the rest of the whole brain. Step C: ICA was performed on functional connectivity maps. Step D: 10 well-established brain networks were identified (NB: in this panel thresholding is only for visualization; IC maps were not thresholded at this stage of analysis) Step E: the spatial regression model was used to calculate the thalamic β maps. Step F: thalamic β maps were constructed for every network. Step G: one sample t-test was performed across every thalamic β map of each subject.

