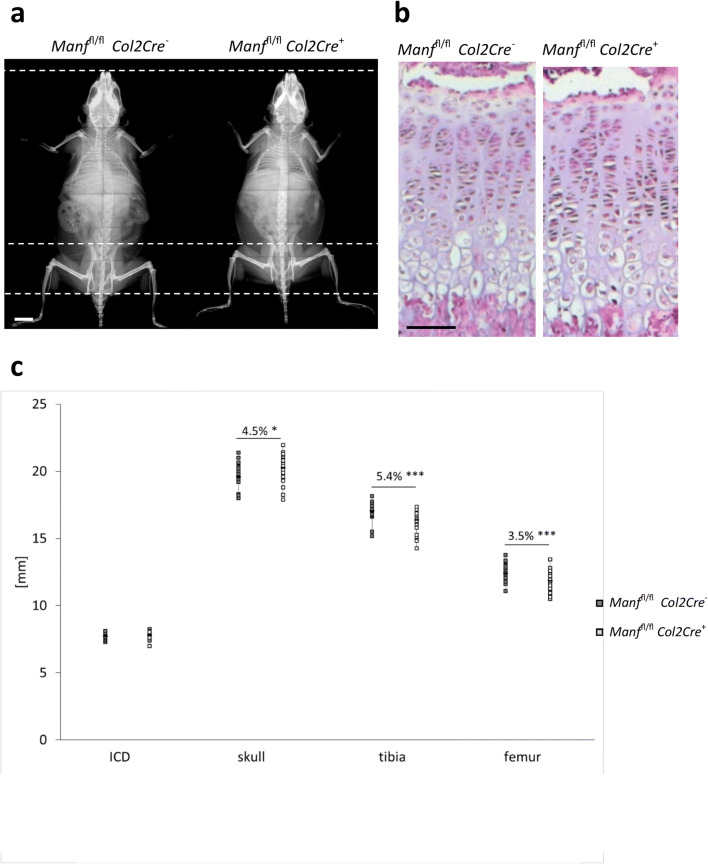
Fig. 2.
X-ray radiographs of Manffl/fl Col2Cre− and Col2Cre+ mice at 9 weeks. b Haematoxylin and eosin staining of Manffl/fl Col2Cre− and Col2Cre+ cartilage growth plates at P21. c Bone measurements of Manffl/fl Col2Cre− and Col2Cre+ mice at P63 showing affected endochondral ossification elements (n > 5). RZ resting zone, PZ proliferative zone, HZ hypertrophic zone. *P < 0.05, ***P < 0.0001. Scale bars 5 mm (a) and 200 μm (b)

