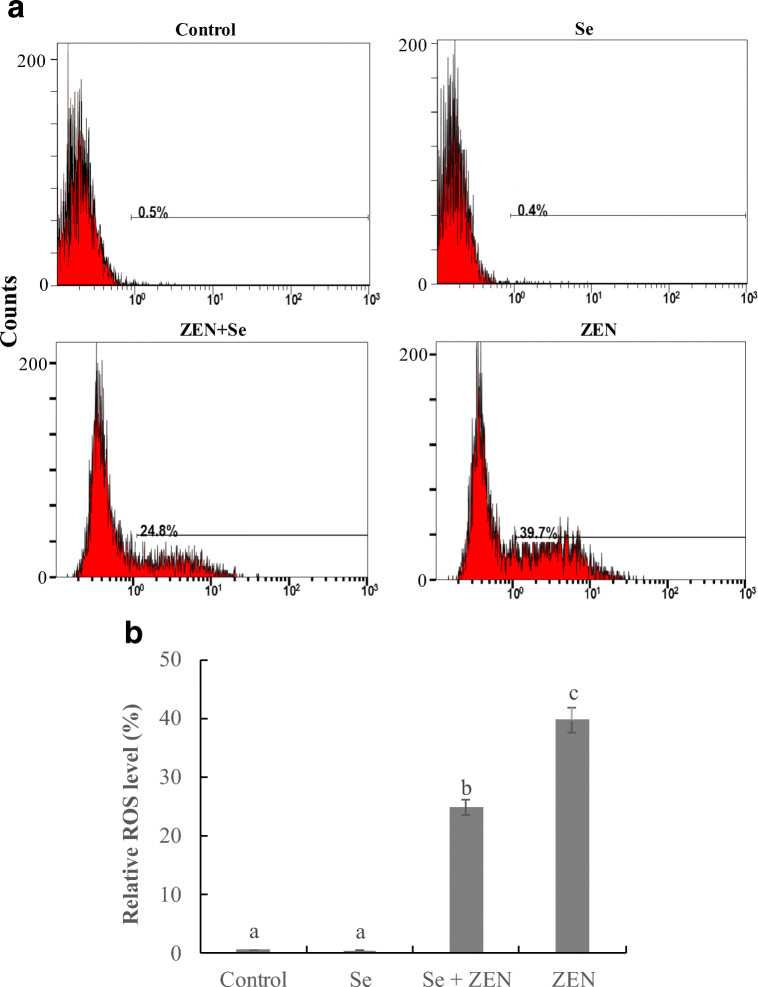
Fig. 1.
The changes of ROS level in chicken splenic lymphocyte treated with Se and ZEN. a Cells were treated with control (untreated), Se, Se + ZEN, ZEN. b Relative ROS level, the data from three independent experiments represent the mean ± SEM, different lowercase letters indicate that there are statistically significance (P < 0.05) among different groups

