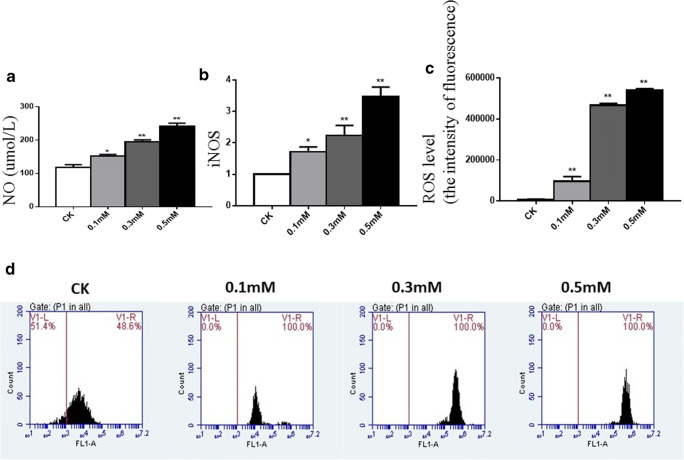
Fig. 2.
Oxidative stress in chondrocytes treated with different concentrations of H2O2. a The levels of NO in cell supernatants in different groups were measured by assay kit. b Cultured and treated chondrocytes were harvested and total RNA was extracted, followed by RT-qPCR for detection of gene expression levels of iNOS. c Results of the levels of intracellular ROS in different groups. d Cultured and treated chondrocytes were harvested and the levels of intracellular ROS in different groups were analyzed with a FACScan flow cytometer. Results are presented as means ± standard deviation of three independent experiments. Untreated chondrocytes were used as normal control. Asterisk indicates P < 0.05, double asterisks indicate P < 0.01 versus normal control

